|
Birmingham, Hodge Hill
Labour hold

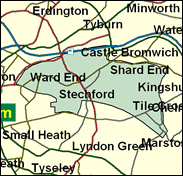
This eastern wedge of the nation's second most populous city contains a mixture of housing and residential types. It is essentially the successor to the Stechford division which Roy Jenkins held for over a quarter of a century before he went to become President of the European Commission in 1976 (upon which his seat was lost for three years to the Tories). There are white council estates, white owner occupied areas like Hodge Hill itself, which returned a Conservative councillor in 2000, and Washwood Heath, 37pc non-white and part of inner east Birmingham's heavily Asian bloc and which returned a Justice for Kashmiris candidate to the City Council in the same year.

Terry Davis, a crumpled bear-like 62 year-old veteran West Midlands Labour MP represented Bromsgrove 1971-74 and this seat since 1979. Educated at King Edward VI Grammar School, Stourbridge, University College London and Michigan University, and a former motor industry manager, he is a Eurosceptic from the centre-right of the party, if occasionally joining the left before 1997 to oppose the Defence estimates. He could well be another target for a peerage, to make way for a last minute Blairite candidate's shoe-in.
 |
| Wealthy Achievers, Suburban Areas |
0.74% |
14.99% |
4.92 |
|
| Affluent Greys, Rural Communities |
0.00% |
2.13% |
0.00 |
|
| Prosperous Pensioners, Retirement Areas |
0.00% |
2.49% |
0.00 |
|
| Affluent Executives, Family Areas |
0.00% |
4.43% |
0.00 |
|
| Well-Off Workers, Family Areas |
3.98% |
7.27% |
54.71 |
|
| Affluent Urbanites, Town & City Areas |
0.10% |
2.56% |
4.02 |
|
| Prosperous Professionals, Metropolitan Areas |
0.00% |
2.04% |
0.00 |
|
| Better-Off Executives, Inner City Areas |
0.00% |
3.94% |
0.00 |
|
| Comfortable Middle Agers, Mature Home Owning Areas |
3.89% |
13.04% |
29.86 |
|
| Skilled Workers, Home Owning Areas |
11.76% |
12.70% |
92.55 |
|
| New Home Owners, Mature Communities |
8.61% |
8.14% |
105.71 |
|
| White Collar Workers, Better-Off Multi Ethnic Areas |
0.00% |
4.02% |
0.00 |
|
| Older People, Less Prosperous Areas |
5.60% |
3.19% |
175.88 |
|
| Council Estate Residents, Better-Off Homes |
47.21% |
11.31% |
417.37 |
|
| Council Estate Residents, High Unemployment |
3.95% |
3.06% |
129.12 |
|
| Council Estate Residents, Greatest Hardship |
3.99% |
2.52% |
158.43 |
|
| People in Multi-Ethnic, Low-Income Areas |
10.17% |
2.10% |
484.13 |
|
| Unclassified |
0.00% |
0.06% |
0.00 |
|
|
 |
 |
 |
| £0-5K |
16.80% |
9.41% |
178.41 |
|
| £5-10K |
23.97% |
16.63% |
144.10 |
|
| £10-15K |
19.72% |
16.58% |
118.96 |
|
| £15-20K |
13.55% |
13.58% |
99.73 |
|
| £20-25K |
8.81% |
10.39% |
84.72 |
|
| £25-30K |
5.66% |
7.77% |
72.81 |
|
| £30-35K |
3.66% |
5.79% |
63.23 |
|
| £35-40K |
2.40% |
4.33% |
55.45 |
|
| £40-45K |
1.60% |
3.27% |
49.06 |
|
| £45-50K |
1.09% |
2.48% |
43.76 |
|
| £50-55K |
0.75% |
1.90% |
39.33 |
|
| £55-60K |
0.52% |
1.47% |
35.59 |
|
| £60-65K |
0.37% |
1.15% |
32.41 |
|
| £65-70K |
0.27% |
0.91% |
29.68 |
|
| £70-75K |
0.20% |
0.72% |
27.32 |
|
| £75-80K |
0.15% |
0.57% |
25.28 |
|
| £80-85K |
0.11% |
0.46% |
23.49 |
|
| £85-90K |
0.08% |
0.37% |
21.91 |
|
| £90-95K |
0.06% |
0.31% |
20.51 |
|
| £95-100K |
0.05% |
0.25% |
19.27 |
|
| £100K + |
0.19% |
1.34% |
14.13 |
|
|
|

|


|
1992-1997
|
1997-2001
|
|
|
|
| Con |
-12.29% |
| Lab |
11.99% |
| LD |
-0.73% |
|
| Con |
-4.05% |
| Lab |
-1.73% |
| LD |
-0.35% |
|
|
 |
Terry Davis
Labour hold
|
| Con |
 |
5,283 |
19.96% |
| Lab |
 |
16,901 |
63.86% |
| LD |
 |
2,147 |
8.11% |
| Oth |
 |
2,134 |
8.06% |
| Maj |
 |
11,618 |
43.90% |
| Turn |
 |
26,465 |
47.90% |
|
|
 |
Terry Davis
Labour hold
|
| SL |
Dennis Cridge |
284 |
1.07% |
| L |
Terry Davis |
16,901 |
63.86% |
| LD |
Alistair Dow |
2,147 |
8.11% |
| UK |
Vivian Harvey |
275 |
1.04% |
| PJP |
Parwez Hussain |
561 |
2.12% |
| Muslim |
Ayub Khan |
125 |
0.47% |
| C |
Debbie Lewis |
5,283 |
19.96% |
| BNP |
Lee Windridge |
889 |
3.36% |
|
Candidates representing 8 parties stood for election to this seat.
|
|
 |
Tery Davis
Labour
|
| Con |
 |
8,198 |
24.01% |
| Lab |
 |
22,398 |
65.59% |
| LD |
 |
2,891 |
8.47% |
| Ref |
|
0 |
0.00% |
| Oth |
 |
660 |
1.93% |
| Maj |
 |
14,200 |
41.58% |
| Turn |
 |
34,147 |
60.91% |
|
|
 |
|
Labour
|
| Con |
 |
14,827 |
36.30% |
| Lab |
 |
21,895 |
53.60% |
| LD |
 |
3,740 |
9.20% |
| Oth |
 |
370 |
0.90% |
| Maj |
 |
7,068 |
17.30% |
| Turn |
 |
40,832 |
70.00% |
|
|
 |
|

|

