|
Surrey Heath
Conservative hold

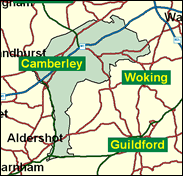
Surrey Heath gave Nick Hawkins, wisely migrating all the way from Blackpool South, a 16,000 majority in the 1997 General Election, the second highest anywhere for the Conservatives. This is indeed heathland, with sandy soil which looks suitable for military exercises. There is a substantial army presence here in Bagshot and Windlesham, Cambereley and Frimley, Chobham and Bisley (as in rifle shooting). This is no kind of target for either the Liberal Democrats or Labour, both floundering about 30pc behind the Tories even in their worst of years.

Nick Hawkins, a junior Home Affairs spokesman, as chicken-runner in 1997 from one of the Conservatives' most marginal seats (Blackpool South) to this, their second safest seat, is clearly one of his party's more electorally adroit politicians. A barrister-turned-corporate-legal-adviser, blessed with non-patrician features and a blunt, partisan manner, born in 1957 and educated at Bedford Modern School and Lincoln College Oxford, he was first elected in 1992. He wobbled against pit closures under the Major government, but was otherwise loyalist on Maastricht and keen on rail privatisation. His high volume, pugnacious call for the party-fund-raising Lord Chancellor's scalp in March 2001 was dismissively wafted away by Labour minister David Lock.
 |
| Wealthy Achievers, Suburban Areas |
43.72% |
14.99% |
291.59 |
|
| Affluent Greys, Rural Communities |
0.00% |
2.13% |
0.00 |
|
| Prosperous Pensioners, Retirement Areas |
0.82% |
2.49% |
33.06 |
|
| Affluent Executives, Family Areas |
17.42% |
4.43% |
393.74 |
|
| Well-Off Workers, Family Areas |
12.42% |
7.27% |
170.74 |
|
| Affluent Urbanites, Town & City Areas |
1.32% |
2.56% |
51.45 |
|
| Prosperous Professionals, Metropolitan Areas |
0.63% |
2.04% |
31.05 |
|
| Better-Off Executives, Inner City Areas |
0.49% |
3.94% |
12.35 |
|
| Comfortable Middle Agers, Mature Home Owning Areas |
10.01% |
13.04% |
76.74 |
|
| Skilled Workers, Home Owning Areas |
4.35% |
12.70% |
34.28 |
|
| New Home Owners, Mature Communities |
5.72% |
8.14% |
70.29 |
|
| White Collar Workers, Better-Off Multi Ethnic Areas |
0.01% |
4.02% |
0.28 |
|
| Older People, Less Prosperous Areas |
0.36% |
3.19% |
11.17 |
|
| Council Estate Residents, Better-Off Homes |
2.40% |
11.31% |
21.22 |
|
| Council Estate Residents, High Unemployment |
0.30% |
3.06% |
9.67 |
|
| Council Estate Residents, Greatest Hardship |
0.00% |
2.52% |
0.00 |
|
| People in Multi-Ethnic, Low-Income Areas |
0.00% |
2.10% |
0.00 |
|
| Unclassified |
0.03% |
0.06% |
42.48 |
|
|
 |
 |
 |
| £0-5K |
3.51% |
9.41% |
37.25 |
|
| £5-10K |
8.04% |
16.63% |
48.32 |
|
| £10-15K |
10.60% |
16.58% |
63.94 |
|
| £15-20K |
11.12% |
13.58% |
81.85 |
|
| £20-25K |
10.46% |
10.39% |
100.65 |
|
| £25-30K |
9.28% |
7.77% |
119.42 |
|
| £30-35K |
7.97% |
5.79% |
137.55 |
|
| £35-40K |
6.70% |
4.33% |
154.68 |
|
| £40-45K |
5.57% |
3.27% |
170.59 |
|
| £45-50K |
4.60% |
2.48% |
185.19 |
|
| £50-55K |
3.78% |
1.90% |
198.45 |
|
| £55-60K |
3.10% |
1.47% |
210.41 |
|
| £60-65K |
2.55% |
1.15% |
221.12 |
|
| £65-70K |
2.09% |
0.91% |
230.66 |
|
| £70-75K |
1.72% |
0.72% |
239.12 |
|
| £75-80K |
1.42% |
0.57% |
246.59 |
|
| £80-85K |
1.17% |
0.46% |
253.15 |
|
| £85-90K |
0.97% |
0.37% |
258.88 |
|
| £90-95K |
0.81% |
0.31% |
263.86 |
|
| £95-100K |
0.67% |
0.25% |
268.16 |
|
| £100K + |
3.75% |
1.34% |
279.09 |
|
|
|

|


|
1992-1997
|
1997-2001
|
|
|
|
| Con |
-12.11% |
| Lab |
9.73% |
| LD |
-1.27% |
|
| Con |
-1.92% |
| Lab |
0.34% |
| LD |
3.85% |
|
|
 |
Nick Hawkins
Conservative hold
|
| Con |
 |
22,401 |
49.67% |
| Lab |
 |
9,640 |
21.37% |
| LD |
 |
11,582 |
25.68% |
| Oth |
 |
1,479 |
3.28% |
| Maj |
 |
10,819 |
23.99% |
| Turn |
 |
45,102 |
59.46% |
|
|
 |
Nick Hawkins
Conservative hold
|
| C |
Nick Hawkins |
22,401 |
49.67% |
| UK |
Nigel Hunt |
1,479 |
3.28% |
| LD |
Mark Lelliot |
11,582 |
25.68% |
| L |
James Norman |
9,640 |
21.37% |
|
Candidates representing 4 parties stood for election to this seat.
|
|
 |
Nick Hawkins
Conservative
|
| Con |
 |
28,231 |
51.59% |
| Lab |
 |
11,511 |
21.03% |
| LD |
 |
11,944 |
21.83% |
| Ref |
 |
2,385 |
4.36% |
| Oth |
 |
653 |
1.19% |
| Maj |
 |
16,287 |
29.76% |
| Turn |
 |
54,724 |
74.14% |
|
|
 |
|
Conservative
|
| Con |
 |
35,731 |
63.70% |
| Lab |
 |
6,326 |
11.30% |
| LD |
 |
12,977 |
23.10% |
| Oth |
 |
1,035 |
1.80% |
| Maj |
 |
22,754 |
40.60% |
| Turn |
 |
56,069 |
78.43% |
|
|
 |
|

|

