|
Surrey South West
Conservative hold

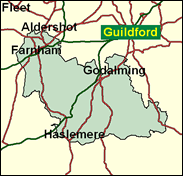
The Tories' most vulnerable seat in the county of Surrey (although even now that isn't saying much), Virginia Bottomley must look over her shoulder to a possible Liberal Democrat challenge, but in the 1999 local elections in the relevant local government authority, which is Waverley (largest towns Farnham, Godalming and Haslemere), the Conservatives returned most candidates and won a higher percentage of the vote; and local elections are well known to be a stronger suit for the Lib Dems than a national contest, so Mrs Bottomley should once again join her husband Peter (Worthing West) in the Commons.

Virginia Bottomley, faded pearl of the Surrey hills, was first elected here in 1984 following the death of Viscount Macmillan, son of Harold. Born 1948 into the high-minded public-serving upper middle class elite that produced her uncle, Douglas Jay, her cousin Peter, and her father John Garnett, ex-Director of the Industrial Society, she attended Putney High School for Girls and Essex University and worked as a psychiatric social worker. A tall, blonde, lisping English rose variously likened to a young Barbara Woodhouse, an Angela Brazil heroine and Mary-Poppins-on-crack, her exposed statistics-sodden defensive performance as Health Secretary towards the fag-end of the Major government was deemed sufficiently voter-hostile for her to be relegated to the margins as National Heritage Secretary, and thence ("voluntarily" according to Hague) to the backbenches after voting for Kenneth Clarke for leader in 1997. Simon Cordon will hope to mobilise the tactical vote for the Liberal Democrats here. A management consultant and experienced councillor transposed from Wiltshire to the Surrey hills, he was born in 1963, educated in Swindon and at Goldsmiths College London, and has campaigned locally on cottage hospitals and against council house sales.
 |
| Wealthy Achievers, Suburban Areas |
51.09% |
14.99% |
340.78 |
|
| Affluent Greys, Rural Communities |
0.01% |
2.13% |
0.59 |
|
| Prosperous Pensioners, Retirement Areas |
5.02% |
2.49% |
201.74 |
|
| Affluent Executives, Family Areas |
3.92% |
4.43% |
88.54 |
|
| Well-Off Workers, Family Areas |
3.66% |
7.27% |
50.28 |
|
| Affluent Urbanites, Town & City Areas |
3.77% |
2.56% |
147.00 |
|
| Prosperous Professionals, Metropolitan Areas |
2.13% |
2.04% |
104.52 |
|
| Better-Off Executives, Inner City Areas |
0.01% |
3.94% |
0.21 |
|
| Comfortable Middle Agers, Mature Home Owning Areas |
20.33% |
13.04% |
155.89 |
|
| Skilled Workers, Home Owning Areas |
0.12% |
12.70% |
0.95 |
|
| New Home Owners, Mature Communities |
6.58% |
8.14% |
80.82 |
|
| White Collar Workers, Better-Off Multi Ethnic Areas |
0.34% |
4.02% |
8.38 |
|
| Older People, Less Prosperous Areas |
0.34% |
3.19% |
10.74 |
|
| Council Estate Residents, Better-Off Homes |
2.15% |
11.31% |
18.97 |
|
| Council Estate Residents, High Unemployment |
0.40% |
3.06% |
13.22 |
|
| Council Estate Residents, Greatest Hardship |
0.00% |
2.52% |
0.00 |
|
| People in Multi-Ethnic, Low-Income Areas |
0.00% |
2.10% |
0.00 |
|
| Unclassified |
0.13% |
0.06% |
210.84 |
|
|
 |
 |
 |
| £0-5K |
4.91% |
9.41% |
52.21 |
|
| £5-10K |
9.80% |
16.63% |
58.90 |
|
| £10-15K |
11.73% |
16.58% |
70.76 |
|
| £15-20K |
11.44% |
13.58% |
84.24 |
|
| £20-25K |
10.21% |
10.39% |
98.23 |
|
| £25-30K |
8.72% |
7.77% |
112.20 |
|
| £30-35K |
7.29% |
5.79% |
125.90 |
|
| £35-40K |
6.03% |
4.33% |
139.19 |
|
| £40-45K |
4.96% |
3.27% |
151.99 |
|
| £45-50K |
4.08% |
2.48% |
164.28 |
|
| £50-55K |
3.35% |
1.90% |
176.05 |
|
| £55-60K |
2.76% |
1.47% |
187.32 |
|
| £60-65K |
2.28% |
1.15% |
198.10 |
|
| £65-70K |
1.89% |
0.91% |
208.43 |
|
| £70-75K |
1.57% |
0.72% |
218.32 |
|
| £75-80K |
1.31% |
0.57% |
227.81 |
|
| £80-85K |
1.10% |
0.46% |
236.93 |
|
| £85-90K |
0.92% |
0.37% |
245.69 |
|
| £90-95K |
0.78% |
0.31% |
254.13 |
|
| £95-100K |
0.66% |
0.25% |
262.26 |
|
| £100K + |
4.17% |
1.34% |
310.57 |
|
|
|

|


|
1992-1997
|
1997-2001
|
|
|
|
| Con |
-13.93% |
| Lab |
3.05% |
| LD |
6.30% |
|
| Con |
0.72% |
| Lab |
-0.73% |
| LD |
3.76% |
|
|
 |
Virginia Bottomley
Conservative hold
|
| Con |
 |
22,462 |
45.29% |
| Lab |
 |
4,321 |
8.71% |
| LD |
 |
21,601 |
43.56% |
| Oth |
 |
1,208 |
2.44% |
| Maj |
 |
861 |
1.74% |
| Turn |
 |
49,592 |
66.90% |
|
|
 |
Virginia Bottomley
Conservative hold
|
| C |
Virginia Bottomley |
22,462 |
45.29% |
| UK |
Timothy Clark |
1,208 |
2.44% |
| LD |
Simon Cordon |
21,601 |
43.56% |
| L |
Martin Whelton |
4,321 |
8.71% |
|
Candidates representing 4 parties stood for election to this seat.
|
|
 |
Virginia Bottomley
Conservative
|
| Con |
 |
25,165 |
44.57% |
| Lab |
 |
5,333 |
9.45% |
| LD |
 |
22,471 |
39.80% |
| Ref |
 |
2,830 |
5.01% |
| Oth |
 |
659 |
1.17% |
| Maj |
 |
2,694 |
4.77% |
| Turn |
 |
56,458 |
78.03% |
|
|
 |
|
Conservative
|
| Con |
 |
35,008 |
58.50% |
| Lab |
 |
3,840 |
6.40% |
| LD |
 |
20,033 |
33.50% |
| Oth |
 |
955 |
1.60% |
| Maj |
 |
14,975 |
25.00% |
| Turn |
 |
59,836 |
82.06% |
|
|
 |
|

|

