|
Sussex Mid
Conservative hold

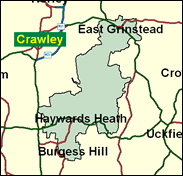
The only seat with the Sussex name in the title, this does not cover many rolling acres of woods and farmland but rather a good three quarters of the electorate is concentarted in just four towns, East Grinstead, Cuckfield, Haywards Heath and Burgess Hill, the latter two dominated by newish private housing on the commuter route north of Brighton, but sharing none of that city's bohemian air and Left-wing politics. This is the sort of place in which people who want to get away from the ethos of London and Brighton live, a safe half way house. It provides a soft landing pad for Nicholas Soames, who has parachuted elegantly out of Crawley, and a substantial majority over the municipally active Liberal Democrats.

Nicholas Soames, a former Defence minister, who has been an MP since 1983, first as Jorrocks-among-the-Gatwick-baggage-handlers as member for Crawley, and since 1997 as member for the more up-market Mid Sussex seat, weighs in at 18 stone-reduced-to-16, 6 foot 3 inches as a loud Bunteresque food mountain. Born 1948, educated at Eton, but then at cerebrally-less-challenged Mons Officer Cadet School (rather than Sandhurst), he is the last remnant, and that in the female line, of the great Spencer-Churchill dynasty which gave the House his grandfather, Sir Winston, his uncle Randolph, and his now-departed cousin, Winston. Out-of-time and out-of-place, he is now out-of-synch with Hague on Europe, and on the "balls-aching nonsense" of Kinseyite management clap-trap, such as MP-bonding sessions at Eastbourne. Elevating snobbery to a fine art he has shouted requests to ex-ship's steward John Prescott for a gin and tonic, dismissed ex-MP Tim Sainsbury as his grocer, and told Dennis Skinner to get in some gulls eggs and his wife out of curlers in case he called in while shooting in Derbyshire. He shot his first stag at 14, compared his baby daughter to a "fair-sized salmon", and was given a colouring book for his fortieth birthday.
 |
| Wealthy Achievers, Suburban Areas |
35.96% |
14.99% |
239.87 |
|
| Affluent Greys, Rural Communities |
0.02% |
2.13% |
1.09 |
|
| Prosperous Pensioners, Retirement Areas |
2.64% |
2.49% |
106.02 |
|
| Affluent Executives, Family Areas |
8.88% |
4.43% |
200.63 |
|
| Well-Off Workers, Family Areas |
13.84% |
7.27% |
190.34 |
|
| Affluent Urbanites, Town & City Areas |
2.79% |
2.56% |
108.64 |
|
| Prosperous Professionals, Metropolitan Areas |
1.23% |
2.04% |
60.46 |
|
| Better-Off Executives, Inner City Areas |
0.55% |
3.94% |
13.95 |
|
| Comfortable Middle Agers, Mature Home Owning Areas |
19.86% |
13.04% |
152.34 |
|
| Skilled Workers, Home Owning Areas |
6.21% |
12.70% |
48.89 |
|
| New Home Owners, Mature Communities |
3.76% |
8.14% |
46.22 |
|
| White Collar Workers, Better-Off Multi Ethnic Areas |
0.28% |
4.02% |
6.87 |
|
| Older People, Less Prosperous Areas |
0.94% |
3.19% |
29.47 |
|
| Council Estate Residents, Better-Off Homes |
2.60% |
11.31% |
22.97 |
|
| Council Estate Residents, High Unemployment |
0.15% |
3.06% |
4.90 |
|
| Council Estate Residents, Greatest Hardship |
0.25% |
2.52% |
9.80 |
|
| People in Multi-Ethnic, Low-Income Areas |
0.00% |
2.10% |
0.00 |
|
| Unclassified |
0.03% |
0.06% |
55.59 |
|
|
 |
 |
 |
| £0-5K |
4.58% |
9.41% |
48.66 |
|
| £5-10K |
10.52% |
16.63% |
63.25 |
|
| £10-15K |
13.08% |
16.58% |
78.90 |
|
| £15-20K |
12.75% |
13.58% |
93.84 |
|
| £20-25K |
11.16% |
10.39% |
107.34 |
|
| £25-30K |
9.27% |
7.77% |
119.23 |
|
| £30-35K |
7.51% |
5.79% |
129.59 |
|
| £35-40K |
6.00% |
4.33% |
138.58 |
|
| £40-45K |
4.78% |
3.27% |
146.35 |
|
| £45-50K |
3.80% |
2.48% |
153.09 |
|
| £50-55K |
3.03% |
1.90% |
158.92 |
|
| £55-60K |
2.42% |
1.47% |
164.00 |
|
| £60-65K |
1.94% |
1.15% |
168.41 |
|
| £65-70K |
1.56% |
0.91% |
172.26 |
|
| £70-75K |
1.26% |
0.72% |
175.61 |
|
| £75-80K |
1.03% |
0.57% |
178.55 |
|
| £80-85K |
0.84% |
0.46% |
181.11 |
|
| £85-90K |
0.69% |
0.37% |
183.35 |
|
| £90-95K |
0.57% |
0.31% |
185.31 |
|
| £95-100K |
0.47% |
0.25% |
187.02 |
|
| £100K + |
2.58% |
1.34% |
192.26 |
|
|
|

|


|
1992-1997
|
1997-2001
|
|
|
|
| Con |
-15.45% |
| Lab |
8.05% |
| LD |
2.43% |
|
| Con |
3.01% |
| Lab |
0.45% |
| LD |
0.68% |
|
|
 |
Nicholas Soames
Conservative hold
|
| Con |
 |
21,150 |
46.46% |
| Lab |
 |
8,693 |
19.10% |
| LD |
 |
14,252 |
31.31% |
| Oth |
 |
1,427 |
3.13% |
| Maj |
 |
6,898 |
15.15% |
| Turn |
 |
45,522 |
64.45% |
|
|
 |
Nicholas Soames
Conservative hold
|
| ML |
Peter Berry |
301 |
0.66% |
| UK |
Petrina Holdsworth |
1,126 |
2.47% |
| L |
Paul Mitchell |
8,693 |
19.10% |
| C |
Nicholas Soames |
21,150 |
46.46% |
| LD |
Lesley Wilkins |
14,252 |
31.31% |
|
Candidates representing 5 parties stood for election to this seat.
|
|
 |
Nicholas Soames
Conservative
|
| Con |
 |
23,231 |
43.45% |
| Lab |
 |
9,969 |
18.65% |
| LD |
 |
16,377 |
30.63% |
| Ref |
 |
3,146 |
5.88% |
| Oth |
 |
740 |
1.38% |
| Maj |
 |
6,854 |
12.82% |
| Turn |
 |
53,463 |
77.73% |
|
|
 |
|
Conservative
|
| Con |
 |
33,415 |
58.90% |
| Lab |
 |
6,034 |
10.60% |
| LD |
 |
16,008 |
28.20% |
| Oth |
 |
1,271 |
2.20% |
| Maj |
 |
17,407 |
30.70% |
| Turn |
 |
56,728 |
80.29% |
|
|
 |
|

|

