|
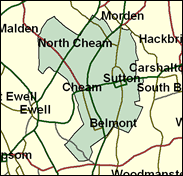
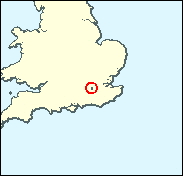
Sutton & Cheam
Liberal Democrat hold

The Liberal Democrats have on occasions managed to convert their ability to achieve success in local elections and taken control of councils into parliamentary seats, although more often this has not proved possible when the governance of the UK as a whole has been at stake. In the Tories' disastrous year of 1997, however, the Lib Dems seized both seats in the London Borough of Sutton, where they have effectively been in control since a Great Leap Forward in 1986. There had been something of a tradition of parliamentary victory in the Sutton and Cheam half of the borough, for Graham Tope had won the seat for the Liberals back in 1972, but he held it then for scarcely over a year, and it was another 23 years before Paul Burstow recaptured the seat. Lady Olga Maitland was the defeated MP on that occasion, and she attempts to regain Sutton and Cheam in a re-run in 2001. As pointed out at the beginning of this piece, local elections are little guide to the outcome, so Burstow can by no means rely on the 23pc lead Liberal Democrat candidates notched up in the 1998 borough elections within this seat.

Paul Burstow, Liberal Democrat apparatchik and victor here in 1997, is a tall, small-nosed bespectacled successor to the similarly featured Graham Tope who won the seat for the Liberals in 1972. Local-boy-made-good in the manner of many Liberals, he was born in 1962, educated at a comprehensive and FE college in Carshalton and at South Bank Poly, and served on Sutton Council for 10 years and worked as a party staffer on local council campaigning. A Social Security spokesman, classlessly-accented and fluent, he cuts a competent dash in the House, but now faces a re-run of his 1997 contest, as the braying Serbo-Scottish aristocrat, Lady Olga Maitland, obeying Central Office instructions to fight again in her old infantry trench rather than chicken-run elsewhere, bids to recapture the affections of bungaloid suburbia. MP here from 1992 to 1997, she was born 1944, educated at St Mary & St Anne's School, Abbots Bromley, and the LycÈe franÁais, London and worked as a Sunday Express gossip columnist, set up the anti Greenham Common Women organisation, Families for Defence, and proselytises for family values and religion.
 |
| Wealthy Achievers, Suburban Areas |
16.83% |
14.99% |
112.25 |
|
| Affluent Greys, Rural Communities |
0.00% |
2.13% |
0.00 |
|
| Prosperous Pensioners, Retirement Areas |
5.01% |
2.49% |
201.68 |
|
| Affluent Executives, Family Areas |
0.72% |
4.43% |
16.21 |
|
| Well-Off Workers, Family Areas |
3.46% |
7.27% |
47.51 |
|
| Affluent Urbanites, Town & City Areas |
8.07% |
2.56% |
314.67 |
|
| Prosperous Professionals, Metropolitan Areas |
8.90% |
2.04% |
435.95 |
|
| Better-Off Executives, Inner City Areas |
2.76% |
3.94% |
69.98 |
|
| Comfortable Middle Agers, Mature Home Owning Areas |
22.42% |
13.04% |
171.97 |
|
| Skilled Workers, Home Owning Areas |
26.22% |
12.70% |
206.45 |
|
| New Home Owners, Mature Communities |
0.00% |
8.14% |
0.00 |
|
| White Collar Workers, Better-Off Multi Ethnic Areas |
0.93% |
4.02% |
23.01 |
|
| Older People, Less Prosperous Areas |
0.73% |
3.19% |
22.97 |
|
| Council Estate Residents, Better-Off Homes |
0.62% |
11.31% |
5.50 |
|
| Council Estate Residents, High Unemployment |
3.19% |
3.06% |
104.27 |
|
| Council Estate Residents, Greatest Hardship |
0.00% |
2.52% |
0.00 |
|
| People in Multi-Ethnic, Low-Income Areas |
0.13% |
2.10% |
6.40 |
|
| Unclassified |
0.00% |
0.06% |
0.00 |
|
|
 |
|
|
| £0-5K |
4.18% |
9.41% |
44.35 |
|
| £5-10K |
9.96% |
16.63% |
59.90 |
|
| £10-15K |
12.78% |
16.58% |
77.07 |
|
| £15-20K |
12.73% |
13.58% |
93.71 |
|
| £20-25K |
11.31% |
10.39% |
108.83 |
|
| £25-30K |
9.49% |
7.77% |
122.11 |
|
| £30-35K |
7.74% |
5.79% |
133.57 |
|
| £35-40K |
6.21% |
4.33% |
143.34 |
|
| £40-45K |
4.95% |
3.27% |
151.62 |
|
| £45-50K |
3.94% |
2.48% |
158.60 |
|
| £50-55K |
3.13% |
1.90% |
164.49 |
|
| £55-60K |
2.50% |
1.47% |
169.43 |
|
| £60-65K |
2.00% |
1.15% |
173.57 |
|
| £65-70K |
1.60% |
0.91% |
177.05 |
|
| £70-75K |
1.29% |
0.72% |
179.95 |
|
| £75-80K |
1.05% |
0.57% |
182.37 |
|
| £80-85K |
0.85% |
0.46% |
184.38 |
|
| £85-90K |
0.70% |
0.37% |
186.03 |
|
| £90-95K |
0.57% |
0.31% |
187.38 |
|
| £95-100K |
0.47% |
0.25% |
188.48 |
|
| £100K + |
2.55% |
1.34% |
189.61 |
|
|
|
|


|
1992-1997
|
1997-2001
|
|
|
|
| Con |
-17.35% |
| Lab |
5.56% |
| LD |
8.50% |
|
| Con |
0.11% |
| Lab |
-2.21% |
| LD |
6.49% |
|
|
|
Paul Burstow
Liberal Democrat hold
|
| Con |
 |
15,078 |
37.96% |
| Lab |
 |
5,263 |
13.25% |
| LD |
 |
19,382 |
48.79% |
| Oth |
|
0 |
0.00% |
| Maj |
 |
4,304 |
10.84% |
| Turn |
|
39,723 |
61.45% |
|
|
|
Paul Burstow
Liberal Democrat hold
|
| LD |
Paul Burstow |
19,382 |
48.79% |
| L |
Lisa Homan |
5,263 |
13.25% |
| C |
Olga Maitland |
15,078 |
37.96% |
|
Candidates representing 3 parties stood for election to this seat.
|
|
|
Paul Burstow
Liberal Democrat gain
|
| Con |
|
17,822 |
37.85% |
| Lab |
|
7,280 |
15.46% |
| LD |
|
19,919 |
42.30% |
| Ref |
 |
1,784 |
3.79% |
| Oth |
 |
287 |
0.61% |
| Maj |
|
2,097 |
4.45% |
| Turn |
|
47,092 |
75.01% |
|
|
|
|
Conservative
|
| Con |
|
27,710 |
55.20% |
| Lab |
|
4,980 |
9.90% |
| LD |
|
16,954 |
33.80% |
| Oth |
|
577 |
1.10% |
| Maj |
|
10,756 |
21.40% |
| Turn |
|
50,221 |
82.30% |
|
|
|
|
|