|
Swansea East
Labour hold

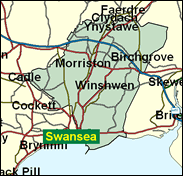
The second city of Wales has its leafy residential areas, parks and university, and indeed Tory wards, but their influence is not to be found in the gritty industrial east end, which no longer includes the city centre either. Labour's Donald Anderson received 29,000 votes in 1997, the Conservatives and Liberal Democrats approximately 3,500 each. Nor is Plaid Cymru a threat in a 90pc English speaking city, although technically they achieved a 29pc swing against Labour on a 36pc turnout in the 1999 Assembly elections - and that wasn't enough.

Donald Anderson, a bald and arthritic, earnest eminence grise as Chairman of the Foreign Affairs Select Committee, was first elected for Monmouth (1966-70) and for this seat in 1974. A non-practising barrister, born 1939, educated at Swansea Grammar School, Swansea University and the Inner Temple, he was initially a diplomat. Formerly for nine years an Opposition spokesman on foreign or legal affairs, he brings to questions such as pornography, drink and Sunday trading a steely Methodist eye, and is a former voter against lowering the homosexual age of consent, reduced in recent votes to mere abstention.
 |
| Wealthy Achievers, Suburban Areas |
4.81% |
14.99% |
32.06 |
|
| Affluent Greys, Rural Communities |
0.00% |
2.13% |
0.00 |
|
| Prosperous Pensioners, Retirement Areas |
0.00% |
2.49% |
0.00 |
|
| Affluent Executives, Family Areas |
1.57% |
4.43% |
35.44 |
|
| Well-Off Workers, Family Areas |
9.53% |
7.27% |
130.97 |
|
| Affluent Urbanites, Town & City Areas |
0.01% |
2.56% |
0.35 |
|
| Prosperous Professionals, Metropolitan Areas |
0.00% |
2.04% |
0.00 |
|
| Better-Off Executives, Inner City Areas |
0.09% |
3.94% |
2.25 |
|
| Comfortable Middle Agers, Mature Home Owning Areas |
8.56% |
13.04% |
65.65 |
|
| Skilled Workers, Home Owning Areas |
32.69% |
12.70% |
257.38 |
|
| New Home Owners, Mature Communities |
13.42% |
8.14% |
164.85 |
|
| White Collar Workers, Better-Off Multi Ethnic Areas |
0.37% |
4.02% |
9.27 |
|
| Older People, Less Prosperous Areas |
5.93% |
3.19% |
186.19 |
|
| Council Estate Residents, Better-Off Homes |
16.51% |
11.31% |
145.99 |
|
| Council Estate Residents, High Unemployment |
1.18% |
3.06% |
38.50 |
|
| Council Estate Residents, Greatest Hardship |
5.33% |
2.52% |
211.53 |
|
| People in Multi-Ethnic, Low-Income Areas |
0.00% |
2.10% |
0.00 |
|
| Unclassified |
0.00% |
0.06% |
0.00 |
|
|
 |
 |
 |
| £0-5K |
13.34% |
9.41% |
141.70 |
|
| £5-10K |
22.12% |
16.63% |
132.97 |
|
| £10-15K |
19.83% |
16.58% |
119.63 |
|
| £15-20K |
14.40% |
13.58% |
105.99 |
|
| £20-25K |
9.72% |
10.39% |
93.57 |
|
| £25-30K |
6.44% |
7.77% |
82.81 |
|
| £30-35K |
4.27% |
5.79% |
73.68 |
|
| £35-40K |
2.86% |
4.33% |
66.00 |
|
| £40-45K |
1.94% |
3.27% |
59.54 |
|
| £45-50K |
1.34% |
2.48% |
54.08 |
|
| £50-55K |
0.94% |
1.90% |
49.44 |
|
| £55-60K |
0.67% |
1.47% |
45.48 |
|
| £60-65K |
0.48% |
1.15% |
42.07 |
|
| £65-70K |
0.35% |
0.91% |
39.12 |
|
| £70-75K |
0.26% |
0.72% |
36.55 |
|
| £75-80K |
0.20% |
0.57% |
34.28 |
|
| £80-85K |
0.15% |
0.46% |
32.29 |
|
| £85-90K |
0.11% |
0.37% |
30.52 |
|
| £90-95K |
0.09% |
0.31% |
28.93 |
|
| £95-100K |
0.07% |
0.25% |
27.51 |
|
| £100K + |
0.29% |
1.34% |
21.46 |
|
|
|

|


|
1992-1997
|
1997-2001
|
|
|
|
| Con |
-7.94% |
| Lab |
5.68% |
| LD |
-0.61% |
| PC |
-0.22% |
|
| Con |
0.80% |
| Lab |
-10.16% |
| LD |
1.29% |
| PC |
8.14% |
|
|
 |
Donald Anderson
Labour hold
|
| Con |
 |
3,026 |
10.06% |
| Lab |
 |
19,612 |
65.22% |
| LD |
 |
3,064 |
10.19% |
| PC |
 |
3,464 |
11.52% |
| Oth |
 |
906 |
3.01% |
| Maj |
 |
16,148 |
53.70% |
| Turn |
 |
30,072 |
52.51% |
|
|
 |
Donald Anderson
Labour hold
|
| L |
Donald Anderson |
19,612 |
65.22% |
| PC |
John Ball |
3,464 |
11.52% |
| UK |
Tim Jenkins |
443 |
1.47% |
| C |
Paul Morris |
3,026 |
10.06% |
| LD |
Robert Speht |
3,064 |
10.19% |
| G |
Tony Young |
463 |
1.54% |
|
Candidates representing 6 parties stood for election to this seat.
|
|
 |
Donald Anderson
Labour
|
| Con |
 |
3,582 |
9.26% |
| Lab |
 |
29,151 |
75.38% |
| LD |
 |
3,440 |
8.89% |
| PC |
 |
1,308 |
3.38% |
| Ref |
 |
904 |
2.34% |
| Oth |
 |
289 |
0.75% |
| Maj |
 |
25,569 |
66.11% |
| Turn |
 |
38,674 |
67.41% |
|
|
 |
|
Labour
|
| Con |
 |
7,697 |
17.20% |
| Lab |
 |
31,179 |
69.70% |
| LD |
 |
4,248 |
9.50% |
| PC |
 |
1,607 |
3.60% |
| Oth |
|
0 |
0.00% |
| Maj |
 |
23,482 |
52.50% |
| Turn |
 |
44,731 |
75.28% |
|
|
 |
|

|

