|
Swansea West
Labour hold

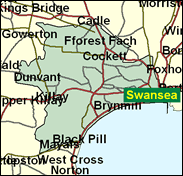
The more desirable residential areas of Swansea are to be found, as in so many cities, to the west of the city centre, at the inner end of the Gower peninsula (the seat does not reach as far out as the Mumbles). Here is Sketty, and Uplands with its literary connections (Dylan Thomas's Cwmdonkin Drive, Kingsley Amis's house when he taught at the university college nearby). But there are also Labour wards like Townhill with its council estate, and the whole of the city centre is now included as boundary changes have moved the seat inwards, exactly the direction the Conservatives (who won this constituency back in the 1950s) did not want. It is now safely Labour at parliamentary level, although Plaid Cymru produced a very good, indeed surprising, strong second place here as elsewhere in the 1999 Assembly elections.

Alan Williams, pencilled-in for a possible last minute peerage to make way for a Blairite parachutist, would be - if he stayed on - Labour's second-longest-running MP, having been first elected here as part of Harold Wilson's majority in 1964 when he won the seat back from the Tories. A junior minister under Wilson and Callaghan, and Opposition spokesman under Foot and Kinnock, he joined the Public Accounts Committee in 1989 and remained thereafter to build a reputation as a scourge of Royal Household expenditure. Out-of-step with Blairite orthodoxy on Europe and devolution, he is seen by ageist younger Labour MPs as part of the 'Alzheimer's Tendency' along with Ted Rowlands (retiring) and Denzil Davies.
 |
| Wealthy Achievers, Suburban Areas |
18.55% |
14.99% |
123.74 |
|
| Affluent Greys, Rural Communities |
0.07% |
2.13% |
3.26 |
|
| Prosperous Pensioners, Retirement Areas |
3.19% |
2.49% |
128.16 |
|
| Affluent Executives, Family Areas |
1.48% |
4.43% |
33.41 |
|
| Well-Off Workers, Family Areas |
3.16% |
7.27% |
43.42 |
|
| Affluent Urbanites, Town & City Areas |
5.00% |
2.56% |
194.94 |
|
| Prosperous Professionals, Metropolitan Areas |
0.06% |
2.04% |
2.81 |
|
| Better-Off Executives, Inner City Areas |
13.14% |
3.94% |
333.09 |
|
| Comfortable Middle Agers, Mature Home Owning Areas |
13.49% |
13.04% |
103.45 |
|
| Skilled Workers, Home Owning Areas |
8.28% |
12.70% |
65.16 |
|
| New Home Owners, Mature Communities |
9.29% |
8.14% |
114.09 |
|
| White Collar Workers, Better-Off Multi Ethnic Areas |
5.51% |
4.02% |
137.06 |
|
| Older People, Less Prosperous Areas |
4.14% |
3.19% |
129.93 |
|
| Council Estate Residents, Better-Off Homes |
4.72% |
11.31% |
41.74 |
|
| Council Estate Residents, High Unemployment |
4.08% |
3.06% |
133.20 |
|
| Council Estate Residents, Greatest Hardship |
5.79% |
2.52% |
230.03 |
|
| People in Multi-Ethnic, Low-Income Areas |
0.00% |
2.10% |
0.00 |
|
| Unclassified |
0.06% |
0.06% |
98.45 |
|
|
 |
 |
 |
| £0-5K |
13.34% |
9.41% |
141.70 |
|
| £5-10K |
20.02% |
16.63% |
120.34 |
|
| £10-15K |
17.80% |
16.58% |
107.34 |
|
| £15-20K |
13.37% |
13.58% |
98.46 |
|
| £20-25K |
9.56% |
10.39% |
91.96 |
|
| £25-30K |
6.76% |
7.77% |
86.96 |
|
| £30-35K |
4.81% |
5.79% |
82.98 |
|
| £35-40K |
3.45% |
4.33% |
79.73 |
|
| £40-45K |
2.51% |
3.27% |
77.01 |
|
| £45-50K |
1.85% |
2.48% |
74.69 |
|
| £50-55K |
1.38% |
1.90% |
72.68 |
|
| £55-60K |
1.05% |
1.47% |
70.92 |
|
| £60-65K |
0.80% |
1.15% |
69.35 |
|
| £65-70K |
0.62% |
0.91% |
67.94 |
|
| £70-75K |
0.48% |
0.72% |
66.66 |
|
| £75-80K |
0.38% |
0.57% |
65.50 |
|
| £80-85K |
0.30% |
0.46% |
64.42 |
|
| £85-90K |
0.24% |
0.37% |
63.43 |
|
| £90-95K |
0.19% |
0.31% |
62.51 |
|
| £95-100K |
0.15% |
0.25% |
61.65 |
|
| £100K + |
0.77% |
1.34% |
57.25 |
|
|
|

|


|
1992-1997
|
1997-2001
|
|
|
|
| Con |
-10.92% |
| Lab |
3.21% |
| LD |
4.01% |
| PC |
2.81% |
|
| Con |
-1.49% |
| Lab |
-7.46% |
| LD |
2.05% |
| PC |
4.00% |
|
|
 |
Alan Williams
Labour hold
|
| Con |
 |
6,094 |
18.99% |
| Lab |
 |
15,644 |
48.75% |
| LD |
 |
5,313 |
16.56% |
| PC |
 |
3,404 |
10.61% |
| Oth |
 |
1,635 |
5.10% |
| Maj |
 |
9,550 |
29.76% |
| Turn |
 |
32,090 |
56.23% |
|
|
 |
Alan Williams
Labour hold
|
| LD |
Mike Day |
5,313 |
16.56% |
| C |
Margaret Harper |
6,094 |
18.99% |
| UK |
Richard Lewis |
653 |
2.03% |
| G |
Martyn Shrewsbury |
616 |
1.92% |
| SA |
Alec Thraves |
366 |
1.14% |
| PC |
Ian Titherington |
3,404 |
10.61% |
| L |
Alan Williams |
15,644 |
48.75% |
|
Candidates representing 7 parties stood for election to this seat.
|
|
 |
Alan Williams
Labour
|
| Con |
 |
8,289 |
20.48% |
| Lab |
 |
22,748 |
56.21% |
| LD |
 |
5,872 |
14.51% |
| PC |
 |
2,675 |
6.61% |
| Ref |
|
0 |
0.00% |
| Oth |
 |
885 |
2.19% |
| Maj |
 |
14,459 |
35.73% |
| Turn |
 |
40,469 |
68.94% |
|
|
 |
|
Labour
|
| Con |
 |
13,760 |
31.40% |
| Lab |
 |
23,238 |
53.00% |
| LD |
 |
4,620 |
10.50% |
| PC |
 |
1,668 |
3.80% |
| Oth |
 |
564 |
1.30% |
| Maj |
 |
9,478 |
21.60% |
| Turn |
 |
43,850 |
72.96% |
|
|
 |
|

|

