|
Swindon North
Labour hold

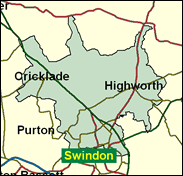
Both Swindon seats, redrawn in time for the 1997 election, come into the category of constituencies which are likely to be won by whoever forms the government at Westminster. North is somewhat better for Labour than south, with a 16pc lead in 1997 compared with 11pc, and this has been confirmed in Euro-elections in 1999 (when Labour was only 4pc behind compared with 10pc in South) although the council, now unitary, has been re-warded which makes the 2000 local elections hard to translate into parliamentary terms. With the continued growth of Swindon in neighbourhoods like Abbey Mead (which returned Conservative councillors in 2000) and the inclusion of semi-rural wards in both seats, neither can be regarded as fully safe for Labour in a fluid situation here in the "M4 corridor" in north Wiltshire.

Michael Wills, a junior Education minister, was elected in 1997 after an acrimonious selection contest in which he as a metropolitan Blairite was pitted against the local AEEU convenor Jim D'Avila, and which with other defeats for its nominated candidates elsewhere, led to AEEU withdrawal of funds from Labour. A tall, smooth and beaky former diplomat and television producer, he was born in 1952 and educated at public school (Haberdashers' Aske's) and Cambridge (Clare College). Appointed by Chancellor Brown to proselytise on behalf of a single European currency, and backing Brown's view of Britain as "the first multicultural, multinational state," he was in 2000 given added ministerial responsibility - as someone of Austrian Jewish and New Zealand Irish Catholic parentage - for "patriotism" and "national identity."
 |
| Wealthy Achievers, Suburban Areas |
9.64% |
14.99% |
64.29 |
|
| Affluent Greys, Rural Communities |
0.15% |
2.13% |
7.13 |
|
| Prosperous Pensioners, Retirement Areas |
0.22% |
2.49% |
8.85 |
|
| Affluent Executives, Family Areas |
15.23% |
4.43% |
344.18 |
|
| Well-Off Workers, Family Areas |
11.78% |
7.27% |
161.90 |
|
| Affluent Urbanites, Town & City Areas |
2.63% |
2.56% |
102.60 |
|
| Prosperous Professionals, Metropolitan Areas |
0.00% |
2.04% |
0.00 |
|
| Better-Off Executives, Inner City Areas |
0.06% |
3.94% |
1.57 |
|
| Comfortable Middle Agers, Mature Home Owning Areas |
15.81% |
13.04% |
121.25 |
|
| Skilled Workers, Home Owning Areas |
22.15% |
12.70% |
174.41 |
|
| New Home Owners, Mature Communities |
6.77% |
8.14% |
83.09 |
|
| White Collar Workers, Better-Off Multi Ethnic Areas |
0.00% |
4.02% |
0.00 |
|
| Older People, Less Prosperous Areas |
2.35% |
3.19% |
73.72 |
|
| Council Estate Residents, Better-Off Homes |
11.06% |
11.31% |
97.81 |
|
| Council Estate Residents, High Unemployment |
0.62% |
3.06% |
20.16 |
|
| Council Estate Residents, Greatest Hardship |
1.45% |
2.52% |
57.71 |
|
| People in Multi-Ethnic, Low-Income Areas |
0.00% |
2.10% |
0.00 |
|
| Unclassified |
0.08% |
0.06% |
121.62 |
|
|
 |
 |
 |
| £0-5K |
6.43% |
9.41% |
68.35 |
|
| £5-10K |
13.55% |
16.63% |
81.45 |
|
| £10-15K |
15.42% |
16.58% |
92.98 |
|
| £15-20K |
13.90% |
13.58% |
102.34 |
|
| £20-25K |
11.38% |
10.39% |
109.48 |
|
| £25-30K |
8.91% |
7.77% |
114.66 |
|
| £30-35K |
6.84% |
5.79% |
118.14 |
|
| £35-40K |
5.21% |
4.33% |
120.21 |
|
| £40-45K |
3.95% |
3.27% |
121.11 |
|
| £45-50K |
3.00% |
2.48% |
121.06 |
|
| £50-55K |
2.29% |
1.90% |
120.25 |
|
| £55-60K |
1.75% |
1.47% |
118.85 |
|
| £60-65K |
1.35% |
1.15% |
116.99 |
|
| £65-70K |
1.04% |
0.91% |
114.78 |
|
| £70-75K |
0.81% |
0.72% |
112.33 |
|
| £75-80K |
0.63% |
0.57% |
109.71 |
|
| £80-85K |
0.49% |
0.46% |
106.99 |
|
| £85-90K |
0.39% |
0.37% |
104.20 |
|
| £90-95K |
0.31% |
0.31% |
101.40 |
|
| £95-100K |
0.25% |
0.25% |
98.62 |
|
| £100K + |
1.11% |
1.34% |
82.39 |
|
|
|

|


|
1992-1997
|
1997-2001
|
|
|
|
| Con |
-7.05% |
| Lab |
7.08% |
| LD |
-1.68% |
|
| Con |
-0.15% |
| Lab |
3.07% |
| LD |
-1.37% |
|
|
 |
Michael Wills
Labour hold
|
| Con |
 |
14,266 |
33.70% |
| Lab |
 |
22,371 |
52.85% |
| LD |
 |
4,891 |
11.55% |
| Oth |
 |
800 |
1.89% |
| Maj |
 |
8,105 |
19.15% |
| Turn |
 |
42,328 |
61.05% |
|
|
 |
Michael Wills
Labour hold
|
| UK |
Brian Lloyd |
800 |
1.89% |
| C |
Nick Martin |
14,266 |
33.70% |
| LD |
David Nation |
4,891 |
11.55% |
| L |
Michael Wills |
22,371 |
52.85% |
|
Candidates representing 4 parties stood for election to this seat.
|
|
 |
Michael Wills
Labour
|
| Con |
 |
16,341 |
33.85% |
| Lab |
 |
24,029 |
49.78% |
| LD |
 |
6,237 |
12.92% |
| Ref |
 |
1,533 |
3.18% |
| Oth |
 |
130 |
0.27% |
| Maj |
 |
7,688 |
15.93% |
| Turn |
 |
48,270 |
73.66% |
|
|
 |
|
Labour
|
| Con |
 |
20,391 |
40.90% |
| Lab |
 |
21,273 |
42.70% |
| LD |
 |
7,299 |
14.60% |
| Oth |
 |
879 |
1.80% |
| Maj |
 |
882 |
1.80% |
| Turn |
 |
49,842 |
77.24% |
|
|
 |
|

|

