|
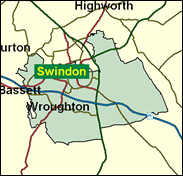
Swindon South
Labour hold

Swindon was the recipient of an extra seat in the 1995 parliamentary boundary changes which came into force in time for the 1997 General Election, and such is the population growth in this rapidly developing part of England that Wiltshire is already earmarked for another extra seat in the next boundary review, which may come into force after the Election after next. Outcomes are always unpredictable in such circumstances, and it is not always easy to produce notional results for heavily altered or new seats, as the team which suggested that Swindon South would have had a Conservative majority of over 10,000 and 18pc in 1992. In any case, Julia Drown actually won for Labour in 1997 by 11pc, and we do know that this will require a swing back to the Tories sufficiently large that if repeated nationally about 65 other Labour seats would fall, reducing the overall majority to under 50 - under 40 if other parties also benefited from an anti-Labour movement of opinion. This would be an unexpected blow for Tony Blair, and provide a boost sufficient to keep William Hague in his job. For all these reasons, Swindon South will be a very important seat at the next general election.

Julia Drown was elected here in 1997, having previously worked as a public service accountant, most recently with the Radcliffe Infirmary in Oxford. London-born in 1962, she attended Hampstead Comprehensive and University College Oxford, as a health service campaigner she loyally defends government initiatives such as prescription charge increases below the rate of inflation and with scores of Labour MPs makes up for any radical deficit by vigorously opposing fox hunting as barbaric as the outlawed practices of bear-bating, cock-fighting and dog-fighting.
 |
| Wealthy Achievers, Suburban Areas |
11.32% |
14.99% |
75.53 |
|
| Affluent Greys, Rural Communities |
0.00% |
2.13% |
0.00 |
|
| Prosperous Pensioners, Retirement Areas |
0.65% |
2.49% |
26.17 |
|
| Affluent Executives, Family Areas |
19.20% |
4.43% |
433.96 |
|
| Well-Off Workers, Family Areas |
7.70% |
7.27% |
105.89 |
|
| Affluent Urbanites, Town & City Areas |
3.84% |
2.56% |
149.71 |
|
| Prosperous Professionals, Metropolitan Areas |
0.00% |
2.04% |
0.00 |
|
| Better-Off Executives, Inner City Areas |
0.80% |
3.94% |
20.26 |
|
| Comfortable Middle Agers, Mature Home Owning Areas |
10.35% |
13.04% |
79.35 |
|
| Skilled Workers, Home Owning Areas |
16.47% |
12.70% |
129.68 |
|
| New Home Owners, Mature Communities |
2.41% |
8.14% |
29.64 |
|
| White Collar Workers, Better-Off Multi Ethnic Areas |
5.50% |
4.02% |
136.64 |
|
| Older People, Less Prosperous Areas |
2.66% |
3.19% |
83.58 |
|
| Council Estate Residents, Better-Off Homes |
17.61% |
11.31% |
155.72 |
|
| Council Estate Residents, High Unemployment |
1.35% |
3.06% |
44.24 |
|
| Council Estate Residents, Greatest Hardship |
0.00% |
2.52% |
0.00 |
|
| People in Multi-Ethnic, Low-Income Areas |
0.00% |
2.10% |
0.00 |
|
| Unclassified |
0.12% |
0.06% |
196.03 |
|
|
 |
 |
 |
| £0-5K |
6.48% |
9.41% |
68.84 |
|
| £5-10K |
14.05% |
16.63% |
84.46 |
|
| £10-15K |
15.72% |
16.58% |
94.84 |
|
| £15-20K |
13.90% |
13.58% |
102.30 |
|
| £20-25K |
11.21% |
10.39% |
107.90 |
|
| £25-30K |
8.72% |
7.77% |
112.16 |
|
| £30-35K |
6.68% |
5.79% |
115.39 |
|
| £35-40K |
5.10% |
4.33% |
117.78 |
|
| £40-45K |
3.90% |
3.27% |
119.49 |
|
| £45-50K |
2.99% |
2.48% |
120.61 |
|
| £50-55K |
2.31% |
1.90% |
121.27 |
|
| £55-60K |
1.79% |
1.47% |
121.52 |
|
| £60-65K |
1.40% |
1.15% |
121.45 |
|
| £65-70K |
1.10% |
0.91% |
121.11 |
|
| £70-75K |
0.87% |
0.72% |
120.55 |
|
| £75-80K |
0.69% |
0.57% |
119.82 |
|
| £80-85K |
0.55% |
0.46% |
118.94 |
|
| £85-90K |
0.44% |
0.37% |
117.94 |
|
| £90-95K |
0.36% |
0.31% |
116.86 |
|
| £95-100K |
0.29% |
0.25% |
115.71 |
|
| £100K + |
1.43% |
1.34% |
106.72 |
|
|
|

|


|
1992-1997
|
1997-2001
|
|
|
|
| Con |
-13.14% |
| Lab |
16.00% |
| LD |
-4.29% |
|
| Con |
-1.38% |
| Lab |
4.51% |
| LD |
-2.50% |
|
|
 |
Julia Drown
Labour hold
|
| Con |
 |
14,919 |
34.39% |
| Lab |
 |
22,260 |
51.31% |
| LD |
 |
5,165 |
11.91% |
| Oth |
 |
1,040 |
2.40% |
| Maj |
 |
7,341 |
16.92% |
| Turn |
 |
43,384 |
61.04% |
|
|
 |
Julia Drown
Labour hold
|
| LD |
Geoff Brewer |
5,165 |
11.91% |
| C |
Simon Coombs |
14,919 |
34.39% |
| L |
Julia Drown |
22,260 |
51.31% |
| RRL |
Roly Gillard |
327 |
0.75% |
| UK |
Vicki Sharp |
713 |
1.64% |
|
Candidates representing 5 parties stood for election to this seat.
|
|
 |
Julia Drown
Labour gain
|
| Con |
 |
18,298 |
35.76% |
| Lab |
 |
23,943 |
46.80% |
| LD |
 |
7,371 |
14.41% |
| Ref |
 |
1,273 |
2.49% |
| Oth |
 |
277 |
0.54% |
| Maj |
 |
5,645 |
11.03% |
| Turn |
 |
51,162 |
72.87% |
|
|
 |
|
Conservative
|
| Con |
 |
27,312 |
48.90% |
| Lab |
 |
17,209 |
30.80% |
| LD |
 |
10,439 |
18.70% |
| Oth |
 |
842 |
1.50% |
| Maj |
 |
10,103 |
18.10% |
| Turn |
 |
55,802 |
81.82% |
|
|
 |
|

|

