|
Tamworth
Labour hold

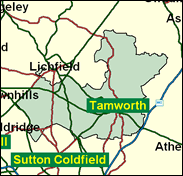
Brian Jenkins won South East Staffordshire in a by-election in 1996 caused by the death of Sir David Lightbown, and defeated his widow by 15pc in the successor seat named Tamworth the next year. The seat will continue to see significant contests. In the May 2000 local elections in Tamworth Borough, the Conservatives won 11 out of 12 wards and beat Labour by nearly 20pc, registering a huge swing since the last contests in those divisions. In 1999 the Conservatives also did very much better than Labour in a handful of rural wards from Lichfield District which are also included in the Tamworth seat. Taken all factors into account, Tamworth is more likely to fall to the new Conservative candidate Luise Gunter than strict consideration of its numerical position on the list of targets suggests. For a start, this seat is in the West Midlands, where Labour has been doing worse than average, and second, the effects of a by-election often take two general elections to work out. Watch out for an aberrant result.

Brian Jenkins, PPS to Joyce Quin, hit the headlines by winning the Staffordshire South East by-election by miles in 1996, and then sank without trace under the huge Blairite intake of 1997 as an inconspicuous backbencher of impeccably loyalist credentials. The archetypal local (FE) lecturer and councillor, he was born 1942 and educated at Kingsbury High School, Tamworth, Coventry College, Coleg Harlech, the LSE and Wolverhampton Polytechnic, and rose from initial occupations as an instrument mechanic and engineer. He has campaigned against the Birmingham Northern Relief Road opposed by Labour in opposition, but sanctioned in office.
 |
| Wealthy Achievers, Suburban Areas |
14.23% |
14.99% |
94.93 |
|
| Affluent Greys, Rural Communities |
0.31% |
2.13% |
14.37 |
|
| Prosperous Pensioners, Retirement Areas |
0.00% |
2.49% |
0.00 |
|
| Affluent Executives, Family Areas |
9.73% |
4.43% |
219.99 |
|
| Well-Off Workers, Family Areas |
20.80% |
7.27% |
285.94 |
|
| Affluent Urbanites, Town & City Areas |
0.04% |
2.56% |
1.63 |
|
| Prosperous Professionals, Metropolitan Areas |
0.00% |
2.04% |
0.00 |
|
| Better-Off Executives, Inner City Areas |
0.18% |
3.94% |
4.57 |
|
| Comfortable Middle Agers, Mature Home Owning Areas |
5.46% |
13.04% |
41.84 |
|
| Skilled Workers, Home Owning Areas |
15.09% |
12.70% |
118.77 |
|
| New Home Owners, Mature Communities |
10.77% |
8.14% |
132.30 |
|
| White Collar Workers, Better-Off Multi Ethnic Areas |
0.93% |
4.02% |
23.24 |
|
| Older People, Less Prosperous Areas |
1.72% |
3.19% |
54.11 |
|
| Council Estate Residents, Better-Off Homes |
16.27% |
11.31% |
143.81 |
|
| Council Estate Residents, High Unemployment |
1.32% |
3.06% |
43.02 |
|
| Council Estate Residents, Greatest Hardship |
3.15% |
2.52% |
125.04 |
|
| People in Multi-Ethnic, Low-Income Areas |
0.00% |
2.10% |
0.00 |
|
| Unclassified |
0.00% |
0.06% |
0.00 |
|
|
 |
 |
 |
| £0-5K |
8.70% |
9.41% |
92.44 |
|
| £5-10K |
16.12% |
16.63% |
96.89 |
|
| £10-15K |
16.72% |
16.58% |
100.83 |
|
| £15-20K |
14.06% |
13.58% |
103.54 |
|
| £20-25K |
10.90% |
10.39% |
104.88 |
|
| £25-30K |
8.17% |
7.77% |
105.09 |
|
| £30-35K |
6.05% |
5.79% |
104.47 |
|
| £35-40K |
4.48% |
4.33% |
103.32 |
|
| £40-45K |
3.33% |
3.27% |
101.85 |
|
| £45-50K |
2.49% |
2.48% |
100.21 |
|
| £50-55K |
1.88% |
1.90% |
98.51 |
|
| £55-60K |
1.43% |
1.47% |
96.80 |
|
| £60-65K |
1.10% |
1.15% |
95.14 |
|
| £65-70K |
0.85% |
0.91% |
93.53 |
|
| £70-75K |
0.66% |
0.72% |
92.01 |
|
| £75-80K |
0.52% |
0.57% |
90.57 |
|
| £80-85K |
0.41% |
0.46% |
89.21 |
|
| £85-90K |
0.33% |
0.37% |
87.92 |
|
| £90-95K |
0.26% |
0.31% |
86.72 |
|
| £95-100K |
0.21% |
0.25% |
85.58 |
|
| £100K + |
1.07% |
1.34% |
79.79 |
|
|
|

|


|
1992-1997
|
1997-2001
|
|
|
|
| Con |
-12.57% |
| Lab |
12.57% |
| LD |
-1.83% |
|
| Con |
0.84% |
| Lab |
-2.77% |
| LD |
3.66% |
|
|
 |
Brian Jenkins
Labour hold
|
| Con |
 |
15,124 |
37.58% |
| Lab |
 |
19,722 |
49.00% |
| LD |
 |
4,721 |
11.73% |
| Oth |
 |
683 |
1.70% |
| Maj |
 |
4,598 |
11.42% |
| Turn |
 |
40,250 |
57.83% |
|
|
 |
Brian Jenkins
Labour hold
|
| C |
Luise Gunter |
15,124 |
37.58% |
| L |
Brian Jenkins |
19,722 |
49.00% |
| LD |
Jennifer Pinkett |
4,721 |
11.73% |
| UK |
Paul Sootheran |
683 |
1.70% |
|
Candidates representing 4 parties stood for election to this seat.
|
|
 |
Brian Jenkins
Labour gain
|
| Con |
 |
18,312 |
36.73% |
| Lab |
 |
25,808 |
51.77% |
| LD |
 |
4,025 |
8.07% |
| Ref |
 |
1,163 |
2.33% |
| Oth |
 |
546 |
1.10% |
| Maj |
 |
7,496 |
15.04% |
| Turn |
 |
49,854 |
74.18% |
|
|
 |
|
Conservative
|
| Con |
 |
26,209 |
49.30% |
| Lab |
 |
20,804 |
39.20% |
| LD |
 |
5,275 |
9.90% |
| Oth |
 |
825 |
1.60% |
| Maj |
 |
5,405 |
10.20% |
| Turn |
 |
53,113 |
81.60% |
|
|
 |
|

|

