|
Tatton
Conservative gain

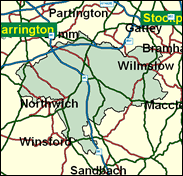
This is one seat where almost no comaprisons, statistical or otherwise, will be able to b emade with the 1997 General Election. Perhaps the most unusual contest in the country took place then, as the former BBC war correspondent Martin Bell donned his white suit and rode into battle against Neil Hamilton, tainted with accusations of sleaze. Labour and Liberal Democrats withdrew their candidates and offered their support to Bell. It was not technically a straight fight - no fewer than eight other candidates were attracted (by the glare of prospective publicity?) but all eyes were on the gladiatorial battle. Bell won by 11,000 and Hamilton (and his wife Christine) retired hurt. However, Bell did promise to serve only one term as MP for Tatton as well as to take no party whip. Finding the atmosphere at Westminster amenable, Bell came to regret this promise, but it would not have fitted in with the maintenance of his air of moral superiority to renege, and he has sought other causes elsewhere, riding off on his charger to Brentwood and Ongar to slay the dragon of the Peniel Church. In his absence, Labour and the Liberal Democrats have re-appeared on the scene, and, more relevantly, Hamilton has been replaced by a new Conservative, George Osborne, who seems virtually certain to win here in affluent Cheshire.

With the retreat of the Man in the White Suit, Martin Bell, Tory expectations of recapturing one of their safest seats rests with George Osborne. One of a knot of high-flying insiders (see also David Cameron, Witney, and Paul Raynes, Romsey), born 1971 and educated at St. Paul's School, Magdalen College Oxford, and Davidson College, USA, he is the complete political apparatchik, having been William Hague's political secretary and speech writer since 1997 and working previously in the Conservative Research Department, as a political adviser at the Ministry of Agriculture and at No. 10 under John Major. He is the son-in-law of Lord Howell, MP for Guildford 1966-97.
 |
| Wealthy Achievers, Suburban Areas |
51.71% |
14.99% |
344.86 |
|
| Affluent Greys, Rural Communities |
0.93% |
2.13% |
43.73 |
|
| Prosperous Pensioners, Retirement Areas |
2.91% |
2.49% |
117.17 |
|
| Affluent Executives, Family Areas |
5.87% |
4.43% |
132.54 |
|
| Well-Off Workers, Family Areas |
2.74% |
7.27% |
37.63 |
|
| Affluent Urbanites, Town & City Areas |
1.36% |
2.56% |
52.89 |
|
| Prosperous Professionals, Metropolitan Areas |
0.63% |
2.04% |
30.71 |
|
| Better-Off Executives, Inner City Areas |
0.00% |
3.94% |
0.00 |
|
| Comfortable Middle Agers, Mature Home Owning Areas |
12.02% |
13.04% |
92.19 |
|
| Skilled Workers, Home Owning Areas |
5.14% |
12.70% |
40.45 |
|
| New Home Owners, Mature Communities |
8.43% |
8.14% |
103.52 |
|
| White Collar Workers, Better-Off Multi Ethnic Areas |
0.33% |
4.02% |
8.14 |
|
| Older People, Less Prosperous Areas |
1.43% |
3.19% |
45.03 |
|
| Council Estate Residents, Better-Off Homes |
4.71% |
11.31% |
41.60 |
|
| Council Estate Residents, High Unemployment |
0.68% |
3.06% |
22.27 |
|
| Council Estate Residents, Greatest Hardship |
1.13% |
2.52% |
44.78 |
|
| People in Multi-Ethnic, Low-Income Areas |
0.00% |
2.10% |
0.00 |
|
| Unclassified |
0.00% |
0.06% |
0.00 |
|
|
 |
 |
 |
| £0-5K |
5.84% |
9.41% |
62.07 |
|
| £5-10K |
11.20% |
16.63% |
67.36 |
|
| £10-15K |
12.73% |
16.58% |
76.76 |
|
| £15-20K |
11.90% |
13.58% |
87.64 |
|
| £20-25K |
10.29% |
10.39% |
99.06 |
|
| £25-30K |
8.59% |
7.77% |
110.51 |
|
| £30-35K |
7.05% |
5.79% |
121.68 |
|
| £35-40K |
5.74% |
4.33% |
132.39 |
|
| £40-45K |
4.65% |
3.27% |
142.55 |
|
| £45-50K |
3.78% |
2.48% |
152.13 |
|
| £50-55K |
3.07% |
1.90% |
161.10 |
|
| £55-60K |
2.50% |
1.47% |
169.50 |
|
| £60-65K |
2.04% |
1.15% |
177.35 |
|
| £65-70K |
1.67% |
0.91% |
184.69 |
|
| £70-75K |
1.38% |
0.72% |
191.54 |
|
| £75-80K |
1.14% |
0.57% |
197.95 |
|
| £80-85K |
0.94% |
0.46% |
203.95 |
|
| £85-90K |
0.78% |
0.37% |
209.56 |
|
| £90-95K |
0.66% |
0.31% |
214.83 |
|
| £95-100K |
0.55% |
0.25% |
219.78 |
|
| £100K + |
3.29% |
1.34% |
244.85 |
|
|
|

|


|
1992-1997
|
1997-2001
|
|
|
|
| Con |
-24.74% |
| Lab |
0.00% |
| LD |
0.00% |
|
| Con |
10.65% |
| Lab |
27.25% |
| LD |
18.62% |
|
|
 |
George Osborne
Conservative gain
|
| Con |
 |
19,860 |
48.11% |
| Lab |
 |
11,249 |
27.25% |
| LD |
 |
7,685 |
18.62% |
| Oth |
 |
2,484 |
6.02% |
| Maj |
 |
8,611 |
20.86% |
| Turn |
 |
41,278 |
63.55% |
|
|
 |
George Osborne
Conservative gain
|
| Tatton |
Viviane Allinson |
505 |
1.22% |
| LD |
Mike Ash |
7,685 |
18.62% |
| Ind Batch |
John Batchelor |
322 |
0.78% |
| Ind Hunt |
Jonathan Boyd |
154 |
0.37% |
| L |
Steve Conquest |
11,249 |
27.25% |
| C |
George Osborne |
19,860 |
48.11% |
| Ind Sh |
Peter Sharratt |
734 |
1.78% |
| UK |
Mark Sheppard |
769 |
1.86% |
|
Candidates representing 8 parties stood for election to this seat.
|
|
 |
Martin Bell
Independent gain
|
| Con |
 |
18,277 |
37.46% |
| Lab |
|
0 |
0.00% |
| LD |
|
0 |
0.00% |
| Ref |
|
0 |
0.00% |
| Ind |
 |
29,354 |
60.16% |
| Oth |
 |
1,161 |
2.38% |
| Maj |
 |
11,077 |
22.70% |
| Turn |
 |
48,792 |
76.45% |
|
|
 |
|
Conservative
|
| Con |
 |
32,235 |
62.20% |
| Lab |
 |
9,870 |
19.00% |
| LD |
 |
9,387 |
18.10% |
| Oth |
 |
350 |
0.70% |
| Maj |
 |
22,365 |
43.10% |
| Turn |
 |
51,842 |
81.38% |
|
|
 |
|

|

