|
Tayside North
Scottish National Party hold

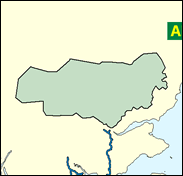
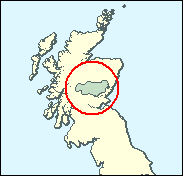
The SNP have six seats at present, all originally won from the Tories. Three seem safe, three are possibly vulnerable to a Conservative revival: Galloway, Perth, and this one, North Tayside, which was gained only in 1997. What is more, John Swinney, the victor then, also subsequently selected as leader of the SNP, is not standing for Westminster again, concentrating as is logical for a Nationalist on the Edinburgh (or true) Parliament. Yet signs of that Tory revival are few and far between, and the new Nationalist candidate Peter Wishart must have at least an even chance to hold it against Conservative Murdo Fraser in the next general election.

With the retreat of the less than charismatic SNP leader, John Swinney, to the Scottish Parliament, the Nationalists are running Peter Wishart as their new candidate here. Somewhat unconventional as SNP candidates go in not being a regulation Scots lawyer or - as likely - a Scots teacher (although trained as one), he is a self-employed musician with the group 'Runrig', and Director of 'Scotland Against Drugs' and 'Fast Forward Positive Lifestyles.' Born 1962 and educated at Queen Anne High School, Dunfermline, and Moray House College of Education, he only joined the SNP in 1997 and is here inheriting an SNP parliamentary seat on his first outing. He describes his family background and school politics as "Socialist".
 |
| Wealthy Achievers, Suburban Areas |
10.29% |
14.99% |
68.61 |
|
| Affluent Greys, Rural Communities |
13.66% |
2.13% |
642.37 |
|
| Prosperous Pensioners, Retirement Areas |
2.17% |
2.49% |
87.47 |
|
| Affluent Executives, Family Areas |
2.31% |
4.43% |
52.17 |
|
| Well-Off Workers, Family Areas |
4.80% |
7.27% |
65.94 |
|
| Affluent Urbanites, Town & City Areas |
0.24% |
2.56% |
9.35 |
|
| Prosperous Professionals, Metropolitan Areas |
0.00% |
2.04% |
0.00 |
|
| Better-Off Executives, Inner City Areas |
0.99% |
3.94% |
25.04 |
|
| Comfortable Middle Agers, Mature Home Owning Areas |
15.34% |
13.04% |
117.62 |
|
| Skilled Workers, Home Owning Areas |
4.94% |
12.70% |
38.89 |
|
| New Home Owners, Mature Communities |
9.26% |
8.14% |
113.75 |
|
| White Collar Workers, Better-Off Multi Ethnic Areas |
2.61% |
4.02% |
65.02 |
|
| Older People, Less Prosperous Areas |
7.83% |
3.19% |
245.82 |
|
| Council Estate Residents, Better-Off Homes |
17.19% |
11.31% |
152.02 |
|
| Council Estate Residents, High Unemployment |
5.48% |
3.06% |
179.01 |
|
| Council Estate Residents, Greatest Hardship |
2.61% |
2.52% |
103.67 |
|
| People in Multi-Ethnic, Low-Income Areas |
0.00% |
2.10% |
0.00 |
|
| Unclassified |
0.27% |
0.06% |
440.99 |
|
|
 |
 |
 |
| £0-5K |
9.81% |
9.41% |
104.26 |
|
| £5-10K |
17.67% |
16.63% |
106.22 |
|
| £10-15K |
17.63% |
16.58% |
106.34 |
|
| £15-20K |
14.24% |
13.58% |
104.83 |
|
| £20-25K |
10.65% |
10.39% |
102.47 |
|
| £25-30K |
7.75% |
7.77% |
99.74 |
|
| £30-35K |
5.61% |
5.79% |
96.88 |
|
| £35-40K |
4.07% |
4.33% |
94.02 |
|
| £40-45K |
2.98% |
3.27% |
91.23 |
|
| £45-50K |
2.20% |
2.48% |
88.55 |
|
| £50-55K |
1.64% |
1.90% |
86.00 |
|
| £55-60K |
1.23% |
1.47% |
83.57 |
|
| £60-65K |
0.94% |
1.15% |
81.27 |
|
| £65-70K |
0.72% |
0.91% |
79.09 |
|
| £70-75K |
0.55% |
0.72% |
77.04 |
|
| £75-80K |
0.43% |
0.57% |
75.10 |
|
| £80-85K |
0.34% |
0.46% |
73.27 |
|
| £85-90K |
0.27% |
0.37% |
71.54 |
|
| £90-95K |
0.21% |
0.31% |
69.90 |
|
| £95-100K |
0.17% |
0.25% |
68.35 |
|
| £100K + |
0.81% |
1.34% |
60.06 |
|
|
|

|


|
1992-1997
|
1997-2001
|
|
|
|
| Con |
-10.68% |
| Lab |
4.28% |
| LD |
0.25% |
| SNP |
6.05% |
|
| Con |
-4.16% |
| Lab |
3.56% |
| LD |
3.18% |
| SNP |
-4.76% |
|
|
 |
Peter Wishart
Scottish National Party hold
|
| Con |
 |
12,158 |
31.57% |
| Lab |
 |
5,715 |
14.84% |
| LD |
 |
4,363 |
11.33% |
| SNP |
 |
15,441 |
40.09% |
| Oth |
 |
840 |
2.18% |
| Maj |
 |
3,283 |
8.52% |
| Turn |
 |
38,517 |
62.48% |
|
|
 |
Peter Wishart
Scottish National Party hold
|
| SSP |
Rosie Adams |
620 |
1.61% |
| L |
Thomas Docherty |
5,715 |
14.84% |
| C |
Murdo Fraser |
12,158 |
31.57% |
| I |
Tina MacDonald |
220 |
0.57% |
| LD |
Julia Robertson |
4,363 |
11.33% |
| SNP |
Peter Wishart |
15,441 |
40.09% |
|
Candidates representing 6 parties stood for election to this seat.
|
|
 |
John Swinney
Scottish National Party gain
|
| Con |
 |
16,287 |
35.72% |
| Lab |
 |
5,141 |
11.28% |
| LD |
 |
3,716 |
8.15% |
| SNP |
 |
20,447 |
44.85% |
| Ref |
|
0 |
0.00% |
| Oth |
|
0 |
0.00% |
| Maj |
 |
4,160 |
9.12% |
| Turn |
 |
45,591 |
74.25% |
|
|
 |
|
Conservative
|
| Con |
 |
21,036 |
46.40% |
| Lab |
 |
3,156 |
7.00% |
| LD |
 |
3,579 |
7.90% |
| SNP |
 |
17,597 |
38.80% |
| Oth |
|
0 |
0.00% |
| Maj |
 |
3,439 |
7.60% |
| Turn |
 |
45,368 |
76.09% |
|
|
 |
|

|

