|
Teignbridge
Liberal Democrat gain

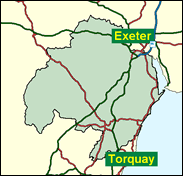
If the Liberal Democrats were really greedy for further success in the West Country next time (and all the signs are that they are) their eyes will light on Teignbridge in Devon, held by only 281 by Patrick Nicholls for the Conservatives in 1997. Yet perhaps this will be a "bridge" too far for the Liberal Democrats. Local elections results are complicated by the fact that the Independents are the most numerous group (21) on the Teignbridge District Council (itself not a good sign) but even so there were more Tories (19) than Liberal Democrats (16) returned in the May 1999 local elections. The Liberal Democrat slate polled the fourth highest number of votes within the seat in the Euro-elections of June that year, behind the UK Independence party and Labour as well as the Conservatives, though this was probably their weakest issue locally and the elections were fought on a remote regional list system which is extremely unfavourable to their style for all their support of proportional representation systems. One suspects though that only the alternative vote, which they oppose nationally as unproportional, would secure victory for them here at the next general election - and that will not be the electoral system in place.

Patrick Nicholls, an aggressively partisan, abrasive rightwinger of manic appearance, was elected here in 1983. He enjoyed a chequered career as junior minister and, later, Conservative Party Vice Chairman, posts from which he had to resign, first over drink-driving (having crusaded against it) and then over xenophobic remarks about the Germans and the French. A prickly solicitor, born 1948 and educated at Redrice College, Andover and Guildford Law College, he saves some of his rudest barbs for Liberal Democrats, describing their conference delegates as "drinking lentil soup and wearing kaftans and sandals, and the women are no better". The former MP David Belotti was "a whippet on steroids". Seen by Dennis Skinner as "totally unemployable anywhere other than in this House now that street cleaning has been thoroughly mechanised", he faces for the third time the Liberal Democrat candidate, Richard Younger-Ross, an architect, who missed by a whisker in 1997. Younger-Ross was born in 1953 into a Conservative-supporting family in suburban Surrey, his father a councillor, and was educated at Walton-on-Thames Secondary School, Ewell Technical College and Oxford Polytechnic. He joined the Liberal Party aged 17, was Vice Chairman of the Young Liberals, and is a member of Anti Slavery International and the Howard League for Penal Reform.
 |
| Wealthy Achievers, Suburban Areas |
19.90% |
14.99% |
132.71 |
|
| Affluent Greys, Rural Communities |
3.55% |
2.13% |
166.76 |
|
| Prosperous Pensioners, Retirement Areas |
14.98% |
2.49% |
602.41 |
|
| Affluent Executives, Family Areas |
2.89% |
4.43% |
65.40 |
|
| Well-Off Workers, Family Areas |
7.35% |
7.27% |
101.07 |
|
| Affluent Urbanites, Town & City Areas |
0.08% |
2.56% |
3.15 |
|
| Prosperous Professionals, Metropolitan Areas |
0.00% |
2.04% |
0.00 |
|
| Better-Off Executives, Inner City Areas |
1.06% |
3.94% |
26.87 |
|
| Comfortable Middle Agers, Mature Home Owning Areas |
22.69% |
13.04% |
173.98 |
|
| Skilled Workers, Home Owning Areas |
5.80% |
12.70% |
45.68 |
|
| New Home Owners, Mature Communities |
8.69% |
8.14% |
106.77 |
|
| White Collar Workers, Better-Off Multi Ethnic Areas |
6.65% |
4.02% |
165.30 |
|
| Older People, Less Prosperous Areas |
1.92% |
3.19% |
60.40 |
|
| Council Estate Residents, Better-Off Homes |
4.34% |
11.31% |
38.36 |
|
| Council Estate Residents, High Unemployment |
0.00% |
3.06% |
0.00 |
|
| Council Estate Residents, Greatest Hardship |
0.07% |
2.52% |
2.81 |
|
| People in Multi-Ethnic, Low-Income Areas |
0.00% |
2.10% |
0.00 |
|
| Unclassified |
0.03% |
0.06% |
45.20 |
|
|
 |
 |
 |
| £0-5K |
9.47% |
9.41% |
100.62 |
|
| £5-10K |
18.20% |
16.63% |
109.43 |
|
| £10-15K |
18.30% |
16.58% |
110.37 |
|
| £15-20K |
14.63% |
13.58% |
107.68 |
|
| £20-25K |
10.76% |
10.39% |
103.52 |
|
| £25-30K |
7.69% |
7.77% |
98.89 |
|
| £30-35K |
5.46% |
5.79% |
94.28 |
|
| £35-40K |
3.89% |
4.33% |
89.89 |
|
| £40-45K |
2.80% |
3.27% |
85.79 |
|
| £45-50K |
2.04% |
2.48% |
82.00 |
|
| £50-55K |
1.50% |
1.90% |
78.53 |
|
| £55-60K |
1.11% |
1.47% |
75.34 |
|
| £60-65K |
0.83% |
1.15% |
72.42 |
|
| £65-70K |
0.63% |
0.91% |
69.74 |
|
| £70-75K |
0.48% |
0.72% |
67.28 |
|
| £75-80K |
0.37% |
0.57% |
65.02 |
|
| £80-85K |
0.29% |
0.46% |
62.93 |
|
| £85-90K |
0.23% |
0.37% |
61.00 |
|
| £90-95K |
0.18% |
0.31% |
59.21 |
|
| £95-100K |
0.14% |
0.25% |
57.55 |
|
| £100K + |
0.66% |
1.34% |
49.42 |
|
|
|

|


|
1992-1997
|
1997-2001
|
|
|
|
| Con |
-11.09% |
| Lab |
4.97% |
| LD |
3.66% |
|
| Con |
0.13% |
| Lab |
-5.55% |
| LD |
5.65% |
|
|
 |
Richard Younger-Ross
Liberal Democrat gain
|
| Con |
 |
23,332 |
39.34% |
| Lab |
 |
7,366 |
12.42% |
| LD |
 |
26,343 |
44.42% |
| Oth |
 |
2,269 |
3.83% |
| Maj |
 |
3,011 |
5.08% |
| Turn |
 |
59,310 |
69.34% |
|
|
 |
Richard Younger-Ross
Liberal Democrat gain
|
| L |
Christopher Bain |
7,366 |
12.42% |
| UK |
Paul Exmouth |
2,269 |
3.83% |
| C |
Patrick Nicholls |
23,332 |
39.34% |
| LD |
Richard Younger-Ross |
26,343 |
44.42% |
|
Candidates representing 4 parties stood for election to this seat.
|
|
 |
Patrick Nicholls
Conservative
|
| Con |
 |
24,679 |
39.21% |
| Lab |
 |
11,311 |
17.97% |
| LD |
 |
24,398 |
38.76% |
| Ref |
|
0 |
0.00% |
| Oth |
 |
2,557 |
4.06% |
| Maj |
 |
281 |
0.45% |
| Turn |
 |
62,945 |
77.08% |
|
|
 |
|
Conservative
|
| Con |
 |
31,740 |
50.30% |
| Lab |
 |
8,181 |
13.00% |
| LD |
 |
22,192 |
35.10% |
| Oth |
 |
1,047 |
1.70% |
| Maj |
 |
9,548 |
15.10% |
| Turn |
 |
63,160 |
82.30% |
|
|
 |
|

|

