|
Telford
Labour hold

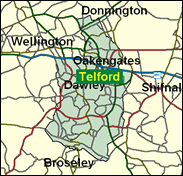
This seat is something of an oddity in the heart of Shropshire. It is named after a new town, which has expanded greatly as the main growth point for the whole of the West Midlands region since the 1950s; yet on the other hand this area has a claim to be the birthplace of the Industrial Revolution, not only in England but in Britain and even the world, if one considers the history of Abraham Darby's Coalbrookedale works, where iron was first smelted with coke in the first decade after 1700, and also other elements in the Ironbridge industrial museum, the most extensive of its kind in the country. There was pre-Telford coal mining around Oakengates, and engineering around Wellington and Dawley existed as a town before it was chosen as the site of what became Telford. Known as The Wrekin after Shropshire's distinctive volcanic hill (definitely pre-Darby!) the forerunner of this seat was won ten times by Labour between their first success back in 1923 and 1992; but it was never truly safe, because of the inclusion of electors from rural Shropshire. Now these have departed with the Wrekin name, and ironically that seat too was won by Labour in the sweep forged in 1997.

In succession to Tony Blair's PPS Bruce Grocott, Labour has picked former Wrekin and Telford councillor Dave Wright. Born 1966 and educated at Wrockwardine Wood Comprehensive, Telford and Wolverhampton Polytechnic, he worked for thirteen years as a housing strategy manager with Sandwell Council and describes himself as a "specialist in the development of housing strategies and public private partnerships".
 |
| Wealthy Achievers, Suburban Areas |
7.75% |
14.99% |
51.72 |
|
| Affluent Greys, Rural Communities |
0.00% |
2.13% |
0.00 |
|
| Prosperous Pensioners, Retirement Areas |
0.00% |
2.49% |
0.00 |
|
| Affluent Executives, Family Areas |
12.16% |
4.43% |
274.73 |
|
| Well-Off Workers, Family Areas |
13.82% |
7.27% |
189.98 |
|
| Affluent Urbanites, Town & City Areas |
0.18% |
2.56% |
7.03 |
|
| Prosperous Professionals, Metropolitan Areas |
0.00% |
2.04% |
0.00 |
|
| Better-Off Executives, Inner City Areas |
0.78% |
3.94% |
19.88 |
|
| Comfortable Middle Agers, Mature Home Owning Areas |
4.36% |
13.04% |
33.45 |
|
| Skilled Workers, Home Owning Areas |
12.94% |
12.70% |
101.83 |
|
| New Home Owners, Mature Communities |
12.30% |
8.14% |
151.09 |
|
| White Collar Workers, Better-Off Multi Ethnic Areas |
0.00% |
4.02% |
0.00 |
|
| Older People, Less Prosperous Areas |
4.15% |
3.19% |
130.41 |
|
| Council Estate Residents, Better-Off Homes |
29.01% |
11.31% |
256.49 |
|
| Council Estate Residents, High Unemployment |
1.17% |
3.06% |
38.08 |
|
| Council Estate Residents, Greatest Hardship |
1.38% |
2.52% |
54.61 |
|
| People in Multi-Ethnic, Low-Income Areas |
0.00% |
2.10% |
0.00 |
|
| Unclassified |
0.00% |
0.06% |
0.00 |
|
|
 |
 |
 |
| £0-5K |
10.89% |
9.41% |
115.72 |
|
| £5-10K |
19.83% |
16.63% |
119.24 |
|
| £10-15K |
18.92% |
16.58% |
114.11 |
|
| £15-20K |
14.52% |
13.58% |
106.88 |
|
| £20-25K |
10.34% |
10.39% |
99.53 |
|
| £25-30K |
7.21% |
7.77% |
92.69 |
|
| £30-35K |
5.01% |
5.79% |
86.53 |
|
| £35-40K |
3.51% |
4.33% |
81.05 |
|
| £40-45K |
2.49% |
3.27% |
76.16 |
|
| £45-50K |
1.78% |
2.48% |
71.81 |
|
| £50-55K |
1.29% |
1.90% |
67.91 |
|
| £55-60K |
0.95% |
1.47% |
64.42 |
|
| £60-65K |
0.71% |
1.15% |
61.26 |
|
| £65-70K |
0.53% |
0.91% |
58.40 |
|
| £70-75K |
0.40% |
0.72% |
55.79 |
|
| £75-80K |
0.31% |
0.57% |
53.41 |
|
| £80-85K |
0.24% |
0.46% |
51.22 |
|
| £85-90K |
0.18% |
0.37% |
49.20 |
|
| £90-95K |
0.14% |
0.31% |
47.33 |
|
| £95-100K |
0.11% |
0.25% |
45.60 |
|
| £100K + |
0.50% |
1.34% |
37.00 |
|
|
|

|


|
1992-1997
|
1997-2001
|
|
|
|
| Con |
-5.91% |
| Lab |
5.01% |
| LD |
-0.62% |
|
| Con |
0.04% |
| Lab |
-3.23% |
| LD |
1.12% |
|
|
 |
David Wright
Labour hold
|
| Con |
 |
8,471 |
27.44% |
| Lab |
 |
16,854 |
54.59% |
| LD |
 |
3,983 |
12.90% |
| Oth |
 |
1,567 |
5.08% |
| Maj |
 |
8,383 |
27.15% |
| Turn |
 |
30,875 |
51.90% |
|
|
 |
David Wright
Labour hold
|
| UK |
Nicola Brookes |
1,098 |
3.56% |
| C |
Andrew Henderson |
8,471 |
27.44% |
| SA |
Mike Jeffries |
469 |
1.52% |
| LD |
Sally Wiggin |
3,983 |
12.90% |
| L |
David Wright |
16,854 |
54.59% |
|
Candidates representing 5 parties stood for election to this seat.
|
|
 |
Bruce Grocott
Labour
|
| Con |
 |
10,166 |
27.39% |
| Lab |
 |
21,456 |
57.81% |
| LD |
 |
4,371 |
11.78% |
| Ref |
 |
1,119 |
3.02% |
| Oth |
|
0 |
0.00% |
| Maj |
 |
11,290 |
30.42% |
| Turn |
 |
37,112 |
65.62% |
|
|
 |
|
Labour
|
| Con |
 |
13,546 |
33.30% |
| Lab |
 |
21,473 |
52.80% |
| LD |
 |
5,049 |
12.40% |
| Oth |
 |
634 |
1.60% |
| Maj |
 |
7,927 |
19.50% |
| Turn |
 |
40,702 |
71.16% |
|
|
 |
|

|

