|
Tewkesbury
Conservative hold

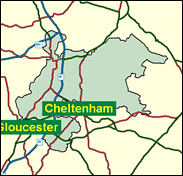
The new seat of Tewkesbury includes not only parts of the much flooded Severn valley and the fringes of the Cotswolds, formerly included in the over-large Cirencester and Tewkesbury but also a number of Gloucester suburbs like Churchdown which were previously in the West Gloucestershire seat along with the Forest of Dean. This splice may have caused some confusion which precluded tactical voting, for Labour's vote seems to have jumped from 10pc to 26pc in 1997, an extraordinary proportional increase, although this may also be due to mis-allocation of votes in the experts' recreation of a notional 1992 General Election result in the new constituencies (see an opposite apparent effect in Forest of Dean). In any case the situation as regards tactics for those who wish to remove Laurence Robertson after just one term is equally unclear now, given the close finish in 1997 and Labour's perceived momentum then. This is good news for Robertson and the beleaguered Tories.

Lawrence Robertson, who came in here in 1997 with a rare-for-the-Tories northern-accented voice, is a Redwood-backing, hard-line Eurosceptic adversary of a single currency, anti-devolutionist, and a voter - with a small knot of Tory MPs - against power-sharing in Northern Ireland. A PR-man who was previously a work study engineer and industrial consultant, he was born in 1958, and attended secondary modern school after failing the 11-plus, before eventually transferring to Farnworth Grammar School. He defends the racing industry (based locally at Cheltenham Race Course), and criticised Hague for sacking Redwood in 2000.
 |
| Wealthy Achievers, Suburban Areas |
27.87% |
14.99% |
185.88 |
|
| Affluent Greys, Rural Communities |
1.19% |
2.13% |
55.90 |
|
| Prosperous Pensioners, Retirement Areas |
3.16% |
2.49% |
126.97 |
|
| Affluent Executives, Family Areas |
10.73% |
4.43% |
242.52 |
|
| Well-Off Workers, Family Areas |
11.59% |
7.27% |
159.35 |
|
| Affluent Urbanites, Town & City Areas |
1.17% |
2.56% |
45.60 |
|
| Prosperous Professionals, Metropolitan Areas |
0.00% |
2.04% |
0.00 |
|
| Better-Off Executives, Inner City Areas |
0.00% |
3.94% |
0.00 |
|
| Comfortable Middle Agers, Mature Home Owning Areas |
23.47% |
13.04% |
180.02 |
|
| Skilled Workers, Home Owning Areas |
5.01% |
12.70% |
39.44 |
|
| New Home Owners, Mature Communities |
6.24% |
8.14% |
76.59 |
|
| White Collar Workers, Better-Off Multi Ethnic Areas |
0.88% |
4.02% |
21.93 |
|
| Older People, Less Prosperous Areas |
1.22% |
3.19% |
38.26 |
|
| Council Estate Residents, Better-Off Homes |
7.01% |
11.31% |
62.00 |
|
| Council Estate Residents, High Unemployment |
0.39% |
3.06% |
12.66 |
|
| Council Estate Residents, Greatest Hardship |
0.07% |
2.52% |
2.90 |
|
| People in Multi-Ethnic, Low-Income Areas |
0.00% |
2.10% |
0.00 |
|
| Unclassified |
0.00% |
0.06% |
0.00 |
|
|
 |
 |
 |
| £0-5K |
6.82% |
9.41% |
72.50 |
|
| £5-10K |
14.18% |
16.63% |
85.24 |
|
| £10-15K |
15.96% |
16.58% |
96.25 |
|
| £15-20K |
14.18% |
13.58% |
104.36 |
|
| £20-25K |
11.41% |
10.39% |
109.82 |
|
| £25-30K |
8.80% |
7.77% |
113.20 |
|
| £30-35K |
6.66% |
5.79% |
115.03 |
|
| £35-40K |
5.02% |
4.33% |
115.75 |
|
| £40-45K |
3.78% |
3.27% |
115.68 |
|
| £45-50K |
2.86% |
2.48% |
115.06 |
|
| £50-55K |
2.17% |
1.90% |
114.06 |
|
| £55-60K |
1.66% |
1.47% |
112.80 |
|
| £60-65K |
1.28% |
1.15% |
111.39 |
|
| £65-70K |
1.00% |
0.91% |
109.87 |
|
| £70-75K |
0.78% |
0.72% |
108.30 |
|
| £75-80K |
0.61% |
0.57% |
106.71 |
|
| £80-85K |
0.49% |
0.46% |
105.11 |
|
| £85-90K |
0.39% |
0.37% |
103.54 |
|
| £90-95K |
0.31% |
0.31% |
102.00 |
|
| £95-100K |
0.25% |
0.25% |
100.49 |
|
| £100K + |
1.23% |
1.34% |
91.70 |
|
|
|

|


|
1992-1997
|
1997-2001
|
|
|
|
| Con |
-8.05% |
| Lab |
16.10% |
| LD |
-7.16% |
|
| Con |
0.34% |
| Lab |
0.72% |
| LD |
-1.80% |
|
|
 |
Laurence Robertson
Conservative hold
|
| Con |
 |
20,830 |
46.09% |
| Lab |
 |
12,167 |
26.92% |
| LD |
 |
11,863 |
26.25% |
| Oth |
 |
335 |
0.74% |
| Maj |
 |
8,663 |
19.17% |
| Turn |
 |
45,195 |
64.31% |
|
|
 |
Laurence Robertson
Conservative hold
|
| L |
Keir Dhillon |
12,167 |
26.92% |
| LD |
Stephen Martin |
11,863 |
26.25% |
| C |
Laurence Robertson |
20,830 |
46.09% |
| I |
Charles Vernall |
335 |
0.74% |
|
Candidates representing 4 parties stood for election to this seat.
|
|
 |
Laurence Robertson
Conservative
|
| Con |
 |
23,859 |
45.75% |
| Lab |
 |
13,665 |
26.20% |
| LD |
 |
14,625 |
28.04% |
| Ref |
|
0 |
0.00% |
| Oth |
|
0 |
0.00% |
| Maj |
 |
9,234 |
17.71% |
| Turn |
 |
52,149 |
76.46% |
|
|
 |
|
Conservative
|
| Con |
 |
28,300 |
53.80% |
| Lab |
 |
5,297 |
10.10% |
| LD |
 |
18,503 |
35.20% |
| Oth |
 |
488 |
0.90% |
| Maj |
 |
9,797 |
18.60% |
| Turn |
 |
52,588 |
81.97% |
|
|
 |
|

|

