|
Thanet North
Conservative hold

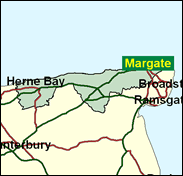
The part of the Isle of Thanet which resisted the Labour tide includes Herne Bay and Reculver, and Margate, Cliftonville, Birchington and Westgate-on-Sea, basically the very south eastern tip of Britain, and although New Labour has made great strides in that quadrant, they are unlikely to go right over the edge to victory. Proximity to Europe has not endeared the EU's ambitions to voters here. In the 1999 European Parliament elections a majority (57pc) of voters who bothered to turn out within the constituency (23pc of the electorate) expressed a preference for either the Conservative or UK Independence party, compared with 49pc for the Tories plus Referendum party in 1997. People here seem to wish that Europe would get further away, not nearer, with time. Like the platoon in Dad's Army, they are exercising with what weapons they can fashion.

Roger Gale, conspicuous as one of the small group of Conservative MPs who regularly vote for fox-hunting bans, was first elected in 1983 having lost Birmingham Northfield to Labour at a 1982 byelection. A former radio and TV producer-turned-PR consultant, he was born 1943, and educated at Hardye's School, Dorchester, and the Guildhall School of Speech & Drama. A campaigner against press excesses, he has targeted Murdoch for an attack on his private life, and The Guardian for its assault on Jonathan Aitken's links with Mohamed Fayed.
 |
| Wealthy Achievers, Suburban Areas |
10.98% |
14.99% |
73.22 |
|
| Affluent Greys, Rural Communities |
0.15% |
2.13% |
6.96 |
|
| Prosperous Pensioners, Retirement Areas |
19.46% |
2.49% |
782.90 |
|
| Affluent Executives, Family Areas |
1.12% |
4.43% |
25.32 |
|
| Well-Off Workers, Family Areas |
2.18% |
7.27% |
29.92 |
|
| Affluent Urbanites, Town & City Areas |
0.76% |
2.56% |
29.75 |
|
| Prosperous Professionals, Metropolitan Areas |
0.00% |
2.04% |
0.00 |
|
| Better-Off Executives, Inner City Areas |
12.54% |
3.94% |
318.00 |
|
| Comfortable Middle Agers, Mature Home Owning Areas |
17.37% |
13.04% |
133.21 |
|
| Skilled Workers, Home Owning Areas |
6.71% |
12.70% |
52.82 |
|
| New Home Owners, Mature Communities |
14.87% |
8.14% |
182.58 |
|
| White Collar Workers, Better-Off Multi Ethnic Areas |
3.86% |
4.02% |
96.08 |
|
| Older People, Less Prosperous Areas |
3.03% |
3.19% |
95.10 |
|
| Council Estate Residents, Better-Off Homes |
5.05% |
11.31% |
44.67 |
|
| Council Estate Residents, High Unemployment |
0.75% |
3.06% |
24.55 |
|
| Council Estate Residents, Greatest Hardship |
1.11% |
2.52% |
44.23 |
|
| People in Multi-Ethnic, Low-Income Areas |
0.00% |
2.10% |
0.00 |
|
| Unclassified |
0.05% |
0.06% |
83.04 |
|
|
 |
 |
 |
| £0-5K |
12.22% |
9.41% |
129.82 |
|
| £5-10K |
19.91% |
16.63% |
119.68 |
|
| £10-15K |
18.48% |
16.58% |
111.47 |
|
| £15-20K |
14.14% |
13.58% |
104.09 |
|
| £20-25K |
10.11% |
10.39% |
97.26 |
|
| £25-30K |
7.07% |
7.77% |
90.93 |
|
| £30-35K |
4.93% |
5.79% |
85.12 |
|
| £35-40K |
3.46% |
4.33% |
79.81 |
|
| £40-45K |
2.45% |
3.27% |
75.00 |
|
| £45-50K |
1.75% |
2.48% |
70.64 |
|
| £50-55K |
1.27% |
1.90% |
66.70 |
|
| £55-60K |
0.93% |
1.47% |
63.15 |
|
| £60-65K |
0.69% |
1.15% |
59.93 |
|
| £65-70K |
0.52% |
0.91% |
57.02 |
|
| £70-75K |
0.39% |
0.72% |
54.37 |
|
| £75-80K |
0.30% |
0.57% |
51.96 |
|
| £80-85K |
0.23% |
0.46% |
49.77 |
|
| £85-90K |
0.18% |
0.37% |
47.76 |
|
| £90-95K |
0.14% |
0.31% |
45.92 |
|
| £95-100K |
0.11% |
0.25% |
44.23 |
|
| £100K + |
0.49% |
1.34% |
36.33 |
|
|
|

|


|
1992-1997
|
1997-2001
|
|
|
|
| Con |
-13.11% |
| Lab |
14.94% |
| LD |
-6.31% |
|
| Con |
6.18% |
| Lab |
-4.05% |
| LD |
-0.40% |
|
|
 |
Roger Gale
Conservative hold
|
| Con |
 |
21,050 |
50.28% |
| Lab |
 |
14,400 |
34.39% |
| LD |
 |
4,603 |
10.99% |
| Oth |
 |
1,815 |
4.34% |
| Maj |
 |
6,650 |
15.88% |
| Turn |
 |
41,868 |
59.32% |
|
|
 |
Roger Gale
Conservative hold
|
| C |
Roger Gale |
21,050 |
50.28% |
| NF |
Thomas Holmes |
395 |
0.94% |
| L |
James Laing |
14,400 |
34.39% |
| UK |
John Moore |
980 |
2.34% |
| LD |
Seth Proctor |
4,603 |
10.99% |
| I |
David Shortt |
440 |
1.05% |
|
Candidates representing 6 parties stood for election to this seat.
|
|
 |
Roger Gale
Conservative
|
| Con |
 |
21,586 |
44.09% |
| Lab |
 |
18,820 |
38.44% |
| LD |
 |
5,576 |
11.39% |
| Ref |
 |
2,535 |
5.18% |
| Oth |
 |
438 |
0.89% |
| Maj |
 |
2,766 |
5.65% |
| Turn |
 |
48,955 |
68.84% |
|
|
 |
|
Conservative
|
| Con |
 |
30,866 |
57.20% |
| Lab |
 |
12,656 |
23.50% |
| LD |
 |
9,563 |
17.70% |
| Oth |
 |
873 |
1.60% |
| Maj |
 |
18,210 |
33.70% |
| Turn |
 |
53,958 |
75.22% |
|
|
 |
|

|

