|
Thurrock
Labour hold

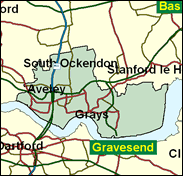
It is hard to believe that the unglamorous south Essex seat of Thurrock, based on Grays, Tilbury, Purfleet, South Ockendon/Belhus and South Ockendon elected a Conservative in 1987. It had returned a 20,000 Labour majority in 1974, but three successive large swings to Mrs Thatcher's party eventually ousted Oonagh McDonald. Now the wheel has turned full circle, and after a huge swing of over 17pc Labour is almost back to its former strength. The seat is situated at the north end of the Thames crossing to Dartford, and features a couple of newish developments: the huge retail centre of Lakeside and the new private housing of Chafford Hundred - which elected a Conservative councillor to Thurrock unitary authority, by 12 votes on a 17pc turnout, in May 2000.

Andrew Mackinlay, a short, chirpy, cockney sparrow who started out on the Right but outflanked there by the Blairites, now seems almost Left-wing as a populist critic of backbench sycophancy and the bowling of "patsy soft-ball questions." This gave him some backing in last year's Parliamentary Labour Party chairmanship's election, though not that much, because he polled only 77 votes. Born 1949 and educated at the Salesian (RC) College, Chertsey, he worked initially as a clerk with Surrey County Council and then for ten years as a NALGO official. A Beckett, not Blair, voter in 1994, he fought four parliamentary contests before winning here in 1992, and has made a mark with his campaign to get pardons for First World War deserters.
 |
| Wealthy Achievers, Suburban Areas |
2.75% |
14.99% |
18.32 |
|
| Affluent Greys, Rural Communities |
0.00% |
2.13% |
0.00 |
|
| Prosperous Pensioners, Retirement Areas |
0.06% |
2.49% |
2.49 |
|
| Affluent Executives, Family Areas |
5.32% |
4.43% |
120.20 |
|
| Well-Off Workers, Family Areas |
8.44% |
7.27% |
116.10 |
|
| Affluent Urbanites, Town & City Areas |
4.52% |
2.56% |
176.26 |
|
| Prosperous Professionals, Metropolitan Areas |
0.00% |
2.04% |
0.00 |
|
| Better-Off Executives, Inner City Areas |
0.50% |
3.94% |
12.73 |
|
| Comfortable Middle Agers, Mature Home Owning Areas |
10.72% |
13.04% |
82.24 |
|
| Skilled Workers, Home Owning Areas |
25.39% |
12.70% |
199.91 |
|
| New Home Owners, Mature Communities |
13.66% |
8.14% |
167.74 |
|
| White Collar Workers, Better-Off Multi Ethnic Areas |
0.54% |
4.02% |
13.51 |
|
| Older People, Less Prosperous Areas |
6.17% |
3.19% |
193.57 |
|
| Council Estate Residents, Better-Off Homes |
17.15% |
11.31% |
151.63 |
|
| Council Estate Residents, High Unemployment |
1.49% |
3.06% |
48.54 |
|
| Council Estate Residents, Greatest Hardship |
2.97% |
2.52% |
117.77 |
|
| People in Multi-Ethnic, Low-Income Areas |
0.00% |
2.10% |
0.00 |
|
| Unclassified |
0.31% |
0.06% |
504.32 |
|
|
 |
 |
 |
| £0-5K |
8.61% |
9.41% |
91.43 |
|
| £5-10K |
15.53% |
16.63% |
93.35 |
|
| £10-15K |
16.23% |
16.58% |
97.89 |
|
| £15-20K |
13.86% |
13.58% |
102.07 |
|
| £20-25K |
10.94% |
10.39% |
105.24 |
|
| £25-30K |
8.34% |
7.77% |
107.33 |
|
| £30-35K |
6.28% |
5.79% |
108.43 |
|
| £35-40K |
4.71% |
4.33% |
108.67 |
|
| £40-45K |
3.53% |
3.27% |
108.22 |
|
| £45-50K |
2.66% |
2.48% |
107.21 |
|
| £50-55K |
2.01% |
1.90% |
105.77 |
|
| £55-60K |
1.53% |
1.47% |
104.01 |
|
| £60-65K |
1.17% |
1.15% |
102.02 |
|
| £65-70K |
0.91% |
0.91% |
99.88 |
|
| £70-75K |
0.70% |
0.72% |
97.63 |
|
| £75-80K |
0.55% |
0.57% |
95.34 |
|
| £80-85K |
0.43% |
0.46% |
93.04 |
|
| £85-90K |
0.34% |
0.37% |
90.74 |
|
| £90-95K |
0.27% |
0.31% |
88.49 |
|
| £95-100K |
0.22% |
0.25% |
86.28 |
|
| £100K + |
0.99% |
1.34% |
73.72 |
|
|
|

|


|
1992-1997
|
1997-2001
|
|
|
|
| Con |
-16.93% |
| Lab |
17.42% |
| LD |
-1.36% |
|
| Con |
3.00% |
| Lab |
-6.79% |
| LD |
2.15% |
|
|
 |
Andrew Mackinlay
Labour hold
|
| Con |
 |
11,124 |
29.77% |
| Lab |
 |
21,121 |
56.53% |
| LD |
 |
3,846 |
10.29% |
| Oth |
 |
1,271 |
3.40% |
| Maj |
 |
9,997 |
26.76% |
| Turn |
 |
37,362 |
48.82% |
|
|
 |
Andrew Mackinlay
Labour hold
|
| LD |
John Lathan |
3,846 |
10.29% |
| L |
Andrew Mackinlay |
21,121 |
56.53% |
| C |
Mike Penning |
11,124 |
29.77% |
| UK |
Christopher Sheppard |
1,271 |
3.40% |
|
Candidates representing 4 parties stood for election to this seat.
|
|
 |
Andrew MacKinlay
Labour
|
| Con |
 |
12,640 |
26.77% |
| Lab |
 |
29,896 |
63.32% |
| LD |
 |
3,843 |
8.14% |
| Ref |
|
0 |
0.00% |
| Oth |
 |
833 |
1.76% |
| Maj |
 |
17,256 |
36.55% |
| Turn |
 |
47,212 |
65.94% |
|
|
 |
|
Labour
|
| Con |
 |
23,619 |
43.70% |
| Lab |
 |
24,791 |
45.90% |
| LD |
 |
5,145 |
9.50% |
| Oth |
 |
508 |
0.90% |
| Maj |
 |
1,172 |
2.20% |
| Turn |
 |
54,063 |
78.15% |
|
|
 |
|

|

