|
Tooting
Labour hold

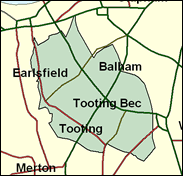
The one seat in the Tory flagship borough of Wandsworth which has always resisted the tide generated by low local taxation, Tooting is more unfashionable than Putney or even Battersea, but it is also over a quarter non-white. In fact this is a very mixed division indeed, with strong Asian, Afro-Caribbean, Irish, professional middle class and even east European elements around the green spaces of Tooting Bec, Wandsworth and Clapham Commons. After several competitive races, it now seems safely Labour.

Tom Cox is one of Labour's longest runners - first elected in 1970. A former power station worker, and before that a Bevin boy, he was born in 1930 and educated (as far as he is prepared to say) at an LCC council school and (in some form) at the LSE. Apart from being a Whip between 1974 and 1979, he has performed as a loud-voiced backbench campaigner against local kerb crawlers, backed the Greeks against the Turks in Cyprus and, when it mattered, kept the Tories out of at least one of the parliamentary seats in their yuppified flagship borough of Wandsworth.
 |
| Wealthy Achievers, Suburban Areas |
0.00% |
14.99% |
0.00 |
|
| Affluent Greys, Rural Communities |
0.00% |
2.13% |
0.00 |
|
| Prosperous Pensioners, Retirement Areas |
0.00% |
2.49% |
0.00 |
|
| Affluent Executives, Family Areas |
0.55% |
4.43% |
12.41 |
|
| Well-Off Workers, Family Areas |
0.25% |
7.27% |
3.48 |
|
| Affluent Urbanites, Town & City Areas |
8.29% |
2.56% |
323.40 |
|
| Prosperous Professionals, Metropolitan Areas |
38.90% |
2.04% |
1,906.02 |
|
| Better-Off Executives, Inner City Areas |
15.68% |
3.94% |
397.63 |
|
| Comfortable Middle Agers, Mature Home Owning Areas |
1.47% |
13.04% |
11.29 |
|
| Skilled Workers, Home Owning Areas |
0.00% |
12.70% |
0.00 |
|
| New Home Owners, Mature Communities |
0.00% |
8.14% |
0.00 |
|
| White Collar Workers, Better-Off Multi Ethnic Areas |
26.66% |
4.02% |
662.98 |
|
| Older People, Less Prosperous Areas |
0.46% |
3.19% |
14.33 |
|
| Council Estate Residents, Better-Off Homes |
0.00% |
11.31% |
0.00 |
|
| Council Estate Residents, High Unemployment |
5.65% |
3.06% |
184.44 |
|
| Council Estate Residents, Greatest Hardship |
0.00% |
2.52% |
0.00 |
|
| People in Multi-Ethnic, Low-Income Areas |
1.81% |
2.10% |
86.13 |
|
| Unclassified |
0.27% |
0.06% |
434.12 |
|
|
 |
 |
 |
| £0-5K |
4.96% |
9.41% |
52.71 |
|
| £5-10K |
9.87% |
16.63% |
59.34 |
|
| £10-15K |
11.84% |
16.58% |
71.41 |
|
| £15-20K |
11.57% |
13.58% |
85.18 |
|
| £20-25K |
10.32% |
10.39% |
99.34 |
|
| £25-30K |
8.81% |
7.77% |
113.32 |
|
| £30-35K |
7.35% |
5.79% |
126.81 |
|
| £35-40K |
6.05% |
4.33% |
139.68 |
|
| £40-45K |
4.96% |
3.27% |
151.87 |
|
| £45-50K |
4.06% |
2.48% |
163.39 |
|
| £50-55K |
3.32% |
1.90% |
174.25 |
|
| £55-60K |
2.72% |
1.47% |
184.49 |
|
| £60-65K |
2.24% |
1.15% |
194.17 |
|
| £65-70K |
1.84% |
0.91% |
203.33 |
|
| £70-75K |
1.52% |
0.72% |
212.00 |
|
| £75-80K |
1.27% |
0.57% |
220.24 |
|
| £80-85K |
1.05% |
0.46% |
228.07 |
|
| £85-90K |
0.88% |
0.37% |
235.54 |
|
| £90-95K |
0.74% |
0.31% |
242.68 |
|
| £95-100K |
0.62% |
0.25% |
249.51 |
|
| £100K + |
3.89% |
1.34% |
289.08 |
|
|
|

|


|
1992-1997
|
1997-2001
|
|
|
|
| Con |
-12.98% |
| Lab |
11.48% |
| LD |
1.97% |
|
| Con |
-0.70% |
| Lab |
-5.59% |
| LD |
5.48% |
|
|
 |
Tom Cox
Labour hold
|
| Con |
 |
9,932 |
26.42% |
| Lab |
 |
20,332 |
54.09% |
| LD |
 |
5,583 |
14.85% |
| Oth |
 |
1,744 |
4.64% |
| Maj |
 |
10,400 |
27.67% |
| Turn |
 |
37,591 |
54.92% |
|
|
 |
Tom Cox
Labour hold
|
| L |
Tom Cox |
20,332 |
54.09% |
| LD |
Simon James |
5,583 |
14.85% |
| G |
Matthew Ledbury |
1,744 |
4.64% |
| C |
Alexander Nicoll |
9,932 |
26.42% |
|
Candidates representing 4 parties stood for election to this seat.
|
|
 |
Tom Cox
Labour
|
| Con |
 |
12,505 |
27.12% |
| Lab |
 |
27,516 |
59.68% |
| LD |
 |
4,320 |
9.37% |
| Ref |
 |
829 |
1.80% |
| Oth |
 |
935 |
2.03% |
| Maj |
 |
15,011 |
32.56% |
| Turn |
 |
46,105 |
69.17% |
|
|
 |
|
Labour
|
| Con |
 |
20,494 |
40.10% |
| Lab |
 |
24,601 |
48.20% |
| LD |
 |
3,776 |
7.40% |
| Oth |
 |
2,217 |
4.30% |
| Maj |
 |
4,107 |
8.00% |
| Turn |
 |
51,088 |
76.00% |
|
|
 |
|

|

