|
Torbay
Liberal Democrat hold

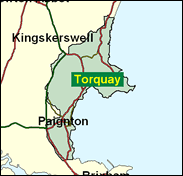
One of the very hottest tips for a change of hands at any general election held in the first half of 2001 would be Torbay. This scarcely takes genius, since Adrian Sanders won by a majority of only 12 votes in 1997, but Liberal Democrats can often hold on to a seat once gained, and the West Country has come to be regarded as one of their heartlands. Yet the local evidence is very alarming indeed for Sanders. In June 1999 the Liberal Democrats were fourth in the voting for the European elections; but this was never their forte. Far worse was the news in May 2000, when the Conservatives swept back to power on Torbay unitary Council, with 32 members to the Liberal Democrats' four, and a lead in the popular vote of nearly 23pc. The Liberal Democrats topped the poll only in Shiphay, and Christian Sweeting must believe that they will have to pull off another miracle to stop him becoming the third MP for Torbay in four years.

Adrian Sanders, an insulin-dependent diabetic, narrowly won here in 1997. Locally born (1959) and educated (Torquay Grammar School)he worked as a Party apparatchik (for Ashdown), fought the seat in 1992, and lost the Devon Euro seat because of a spoiling 'Literal Democrat' candidate siphoning-off 10,000 votes in 1994. A housing spokesman, he campaigns for diabetes and for the deprived south west peninsula, and has been dubbed "Sanders of the Riviera". The Tories expect to win here with Christian (St. John) Sweeting, born 1968, locally-educated at Tower House School, Paignton, South Devon Technical college and Oxford Brookes University. He is a chartered surveyor and property developer with his own London W1-based company, Courtview Estates, and an associate of the rightwing Centre for Policy Studies. Opposed to the euro "in principle" and wanting a referendum on continued EU membership, as a law-and-order campaigner he looked all set until he was charged in April with possessing an air rifle with intent to cause another to believe that unlawful violence would be used against him. The charge was subsequently changed to a lesser public order offence because of a lack of evidence. But Mr Sweeting, who denies the charge, faces a court appearance on May 15.
 |
| Wealthy Achievers, Suburban Areas |
7.52% |
14.99% |
50.18 |
|
| Affluent Greys, Rural Communities |
4.75% |
2.13% |
223.53 |
|
| Prosperous Pensioners, Retirement Areas |
13.59% |
2.49% |
546.56 |
|
| Affluent Executives, Family Areas |
0.22% |
4.43% |
4.98 |
|
| Well-Off Workers, Family Areas |
3.29% |
7.27% |
45.18 |
|
| Affluent Urbanites, Town & City Areas |
0.64% |
2.56% |
25.11 |
|
| Prosperous Professionals, Metropolitan Areas |
0.05% |
2.04% |
2.53 |
|
| Better-Off Executives, Inner City Areas |
11.13% |
3.94% |
282.25 |
|
| Comfortable Middle Agers, Mature Home Owning Areas |
17.97% |
13.04% |
137.83 |
|
| Skilled Workers, Home Owning Areas |
14.63% |
12.70% |
115.15 |
|
| New Home Owners, Mature Communities |
8.38% |
8.14% |
102.96 |
|
| White Collar Workers, Better-Off Multi Ethnic Areas |
10.71% |
4.02% |
266.24 |
|
| Older People, Less Prosperous Areas |
2.97% |
3.19% |
93.10 |
|
| Council Estate Residents, Better-Off Homes |
2.52% |
11.31% |
22.31 |
|
| Council Estate Residents, High Unemployment |
0.44% |
3.06% |
14.35 |
|
| Council Estate Residents, Greatest Hardship |
1.05% |
2.52% |
41.80 |
|
| People in Multi-Ethnic, Low-Income Areas |
0.00% |
2.10% |
0.00 |
|
| Unclassified |
0.13% |
0.06% |
211.31 |
|
|
 |
 |
 |
| £0-5K |
10.94% |
9.41% |
116.22 |
|
| £5-10K |
20.50% |
16.63% |
123.28 |
|
| £10-15K |
19.72% |
16.58% |
118.96 |
|
| £15-20K |
14.94% |
13.58% |
110.02 |
|
| £20-25K |
10.39% |
10.39% |
100.01 |
|
| £25-30K |
7.03% |
7.77% |
90.46 |
|
| £30-35K |
4.75% |
5.79% |
81.94 |
|
| £35-40K |
3.23% |
4.33% |
74.54 |
|
| £40-45K |
2.23% |
3.27% |
68.17 |
|
| £45-50K |
1.56% |
2.48% |
62.72 |
|
| £50-55K |
1.11% |
1.90% |
58.03 |
|
| £55-60K |
0.80% |
1.47% |
53.99 |
|
| £60-65K |
0.58% |
1.15% |
50.49 |
|
| £65-70K |
0.43% |
0.91% |
47.43 |
|
| £70-75K |
0.32% |
0.72% |
44.75 |
|
| £75-80K |
0.24% |
0.57% |
42.38 |
|
| £80-85K |
0.19% |
0.46% |
40.28 |
|
| £85-90K |
0.14% |
0.37% |
38.40 |
|
| £90-95K |
0.11% |
0.31% |
36.71 |
|
| £95-100K |
0.09% |
0.25% |
35.19 |
|
| £100K + |
0.38% |
1.34% |
28.49 |
|
|
|

|


|
1992-1997
|
1997-2001
|
|
|
|
| Con |
-10.36% |
| Lab |
5.26% |
| LD |
-0.24% |
|
| Con |
-2.96% |
| Lab |
-5.38% |
| LD |
11.19% |
|
|
 |
Adrian Sanders
Liberal Democrat hold
|
| Con |
 |
17,307 |
36.58% |
| Lab |
 |
4,484 |
9.48% |
| LD |
 |
24,015 |
50.75% |
| Oth |
 |
1,512 |
3.20% |
| Maj |
 |
6,708 |
14.18% |
| Turn |
 |
47,318 |
65.35% |
|
|
 |
Adrian Sanders
Liberal Democrat hold
|
| UK |
Graham Booth |
1,512 |
3.20% |
| L |
John McKay |
4,484 |
9.48% |
| LD |
Adrian Sanders |
24,015 |
50.75% |
| C |
Christian Sweeting |
17,307 |
36.58% |
|
Candidates representing 4 parties stood for election to this seat.
|
|
 |
Adrian Sanders
Liberal Democrat gain
|
| Con |
 |
21,082 |
39.54% |
| Lab |
 |
7,923 |
14.86% |
| LD |
 |
21,094 |
39.56% |
| Ref |
|
0 |
0.00% |
| Oth |
 |
3,223 |
6.04% |
| Maj |
 |
12 |
0.02% |
| Turn |
 |
53,322 |
73.79% |
|
|
 |
|
Conservative
|
| Con |
 |
28,624 |
49.90% |
| Lab |
 |
5,503 |
9.60% |
| LD |
 |
22,837 |
39.80% |
| Oth |
 |
425 |
0.70% |
| Maj |
 |
5,787 |
10.10% |
| Turn |
 |
57,389 |
81.12% |
|
|
 |
|

|

