|
Torfaen
Labour hold

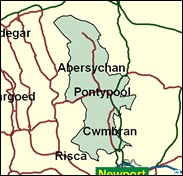
The furthest east of the series of seats that cover the great South Wales valleys, this constituency has two elements, which are compatible enough: the older residential and industrial, mainly ex-mining, areas around Pontypool; and the New Town of Cwmbran. Both are strongly Labour, and in general elections return the Secretary of State for Wales, Paul Murphy. In the Welsh assembly elections a very strange result occurred. Labour were well ahead then too, and second and third places in the first past the post Torfaen contest were taken by two Independent candidates. Plaid Cymru and the Liberal Democrats tied for fourth with 2,614 vote of 10.93pc each - and the Conservatives finished an inglorious sixth.

Paul Murphy, Secretary of State for Wales, was first elected here in 1987 as a lacklustre-seeming replacement for the exotic Leo Abse, but reached the front bench as early as 1988. He earned his Cabinet seat by his role as a negotiator of the Good Friday Agreement, as the statutory Catholic minister in the Northern Ireland Office. He was born 1948, the son of a Welsh-Irish Catholic miner and educated at West Monmouth School, Pontypool and Oriel College Oxford, and was a FE college lecturer in Ebbw Vale for 16 years. Safe but uncharismatic, his lugubrious countenance is well suited to the imminent destruction of his area's main single source of employment, the Llanwern steelworks.
 |
| Wealthy Achievers, Suburban Areas |
2.61% |
14.99% |
17.38 |
|
| Affluent Greys, Rural Communities |
0.00% |
2.13% |
0.00 |
|
| Prosperous Pensioners, Retirement Areas |
0.16% |
2.49% |
6.55 |
|
| Affluent Executives, Family Areas |
5.79% |
4.43% |
130.76 |
|
| Well-Off Workers, Family Areas |
5.82% |
7.27% |
80.05 |
|
| Affluent Urbanites, Town & City Areas |
0.00% |
2.56% |
0.00 |
|
| Prosperous Professionals, Metropolitan Areas |
0.00% |
2.04% |
0.00 |
|
| Better-Off Executives, Inner City Areas |
0.00% |
3.94% |
0.00 |
|
| Comfortable Middle Agers, Mature Home Owning Areas |
2.83% |
13.04% |
21.74 |
|
| Skilled Workers, Home Owning Areas |
26.58% |
12.70% |
209.21 |
|
| New Home Owners, Mature Communities |
20.94% |
8.14% |
257.20 |
|
| White Collar Workers, Better-Off Multi Ethnic Areas |
0.65% |
4.02% |
16.19 |
|
| Older People, Less Prosperous Areas |
6.55% |
3.19% |
205.77 |
|
| Council Estate Residents, Better-Off Homes |
22.44% |
11.31% |
198.37 |
|
| Council Estate Residents, High Unemployment |
0.70% |
3.06% |
22.96 |
|
| Council Estate Residents, Greatest Hardship |
4.92% |
2.52% |
195.42 |
|
| People in Multi-Ethnic, Low-Income Areas |
0.00% |
2.10% |
0.00 |
|
| Unclassified |
0.00% |
0.06% |
0.00 |
|
|
 |
 |
 |
| £0-5K |
12.12% |
9.41% |
128.76 |
|
| £5-10K |
20.66% |
16.63% |
124.23 |
|
| £10-15K |
19.14% |
16.58% |
115.48 |
|
| £15-20K |
14.39% |
13.58% |
105.97 |
|
| £20-25K |
10.08% |
10.39% |
96.99 |
|
| £25-30K |
6.91% |
7.77% |
88.93 |
|
| £30-35K |
4.74% |
5.79% |
81.84 |
|
| £35-40K |
3.28% |
4.33% |
75.63 |
|
| £40-45K |
2.29% |
3.27% |
70.19 |
|
| £45-50K |
1.62% |
2.48% |
65.39 |
|
| £50-55K |
1.16% |
1.90% |
61.13 |
|
| £55-60K |
0.85% |
1.47% |
57.35 |
|
| £60-65K |
0.62% |
1.15% |
53.97 |
|
| £65-70K |
0.46% |
0.91% |
50.93 |
|
| £70-75K |
0.35% |
0.72% |
48.19 |
|
| £75-80K |
0.26% |
0.57% |
45.72 |
|
| £80-85K |
0.20% |
0.46% |
43.47 |
|
| £85-90K |
0.16% |
0.37% |
41.42 |
|
| £90-95K |
0.12% |
0.31% |
39.55 |
|
| £95-100K |
0.09% |
0.25% |
37.84 |
|
| £100K + |
0.40% |
1.34% |
30.05 |
|
|
|

|


|
1992-1997
|
1997-2001
|
|
|
|
| Con |
-7.98% |
| Lab |
4.96% |
| LD |
-0.96% |
| PC |
-0.19% |
|
| Con |
3.58% |
| Lab |
-6.96% |
| LD |
-0.97% |
| PC |
5.31% |
|
|
 |
Paul Murphy
Labour hold
|
| Con |
 |
5,603 |
15.90% |
| Lab |
 |
21,883 |
62.09% |
| LD |
 |
3,936 |
11.17% |
| PC |
 |
2,720 |
7.72% |
| Oth |
 |
1,100 |
3.12% |
| Maj |
 |
16,280 |
46.19% |
| Turn |
 |
35,242 |
57.67% |
|
|
 |
Paul Murphy
Labour hold
|
| SA |
Steve Bell |
443 |
1.26% |
| C |
Jason Evans |
5,603 |
15.90% |
| LD |
Alan Masters |
3,936 |
11.17% |
| L |
Paul Murphy |
21,883 |
62.09% |
| PC |
Stephen Smith |
2,720 |
7.72% |
| UK |
Brenda Vipass |
657 |
1.86% |
|
Candidates representing 6 parties stood for election to this seat.
|
|
 |
Paul Murphy
Labour
|
| Con |
 |
5,327 |
12.32% |
| Lab |
 |
29,863 |
69.06% |
| LD |
 |
5,249 |
12.14% |
| PC |
 |
1,042 |
2.41% |
| Ref |
 |
1,245 |
2.88% |
| Oth |
 |
519 |
1.20% |
| Maj |
 |
24,536 |
56.74% |
| Turn |
 |
43,245 |
71.67% |
|
|
 |
|
Labour
|
| Con |
 |
9,598 |
20.30% |
| Lab |
 |
30,352 |
64.10% |
| LD |
 |
6,178 |
13.10% |
| PC |
 |
1,210 |
2.60% |
| Oth |
|
0 |
0.00% |
| Maj |
 |
20,754 |
43.80% |
| Turn |
 |
47,338 |
76.69% |
|
|
 |
|

|

