|
Totnes
Conservative hold

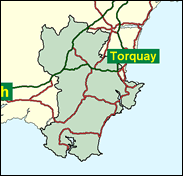
One of three seats narrowly held by the Conservatives in Devon in 1997, Totnes covers the deeply attractive country of the South Hams, on that large county's southern coast, with its cliffs and points and creeks delving inland in flooded valleys among wooded hills. Here are the elegant little ports of Salcombe and Dartmouth, home of the Royal Naval College, and Totnes, a centre of folk art with a whiff of the 1960s. The Liberal Democrats are certainly strong challengers in parliamentary elections, but they have not been matching the Tories in South Hams district council results of late and did even more poorly in the 1999 European elections than in other West Country hopefuls. One feels they will exert more energy in trying to hold nearby Torbay, or if in a more optimistic mood, to pick up Teignbridge.

Anthony Steen, a rare Tory MP dating back to the Heath leadership, was first elected (for Liverpool Wavertree) in 1974 and transferred here (as South Hams) in 1983. A socially-concerned environment critic of excessive housing sprawl, who despite Euroscepticism, backed Clarke in 1997, he was born 1939, educated at Westminster School and - originally a barrister - was a Lloyds underwriter for 26 years. One of the few Tory MPs with a Jewish background, a loather of smoking, tall and with a shock of white hair, and a fanatical cyclist, he cuts a slightly mad-professor figure. He is threatened by the Liberal Democrats' Rachel Oliver, a Cheltenham Ladies College, SOAS and King's College London-educated PR consultant. Her father was a Conservative councillor in Somerset and she is married to a corporate lawyer - neither of which credentials is designed to frighten the few additional 1997 Tory voters she needs to attract. Previously she worked for North Devon Liberal Democrat MP Nick Harvey and for the RNID.
 |
| Wealthy Achievers, Suburban Areas |
7.02% |
14.99% |
46.80 |
|
| Affluent Greys, Rural Communities |
22.28% |
2.13% |
1,047.86 |
|
| Prosperous Pensioners, Retirement Areas |
13.87% |
2.49% |
558.00 |
|
| Affluent Executives, Family Areas |
0.15% |
4.43% |
3.42 |
|
| Well-Off Workers, Family Areas |
1.96% |
7.27% |
26.90 |
|
| Affluent Urbanites, Town & City Areas |
0.00% |
2.56% |
0.00 |
|
| Prosperous Professionals, Metropolitan Areas |
0.00% |
2.04% |
0.00 |
|
| Better-Off Executives, Inner City Areas |
0.16% |
3.94% |
4.11 |
|
| Comfortable Middle Agers, Mature Home Owning Areas |
21.09% |
13.04% |
161.76 |
|
| Skilled Workers, Home Owning Areas |
3.49% |
12.70% |
27.47 |
|
| New Home Owners, Mature Communities |
14.82% |
8.14% |
182.01 |
|
| White Collar Workers, Better-Off Multi Ethnic Areas |
8.03% |
4.02% |
199.76 |
|
| Older People, Less Prosperous Areas |
2.70% |
3.19% |
84.86 |
|
| Council Estate Residents, Better-Off Homes |
3.22% |
11.31% |
28.48 |
|
| Council Estate Residents, High Unemployment |
0.30% |
3.06% |
9.70 |
|
| Council Estate Residents, Greatest Hardship |
0.85% |
2.52% |
33.77 |
|
| People in Multi-Ethnic, Low-Income Areas |
0.00% |
2.10% |
0.00 |
|
| Unclassified |
0.05% |
0.06% |
80.88 |
|
|
 |
 |
 |
| £0-5K |
11.34% |
9.41% |
120.49 |
|
| £5-10K |
20.26% |
16.63% |
121.83 |
|
| £10-15K |
19.18% |
16.58% |
115.70 |
|
| £15-20K |
14.59% |
13.58% |
107.44 |
|
| £20-25K |
10.28% |
10.39% |
98.92 |
|
| £25-30K |
7.07% |
7.77% |
90.89 |
|
| £30-35K |
4.84% |
5.79% |
83.60 |
|
| £35-40K |
3.34% |
4.33% |
77.09 |
|
| £40-45K |
2.33% |
3.27% |
71.33 |
|
| £45-50K |
1.64% |
2.48% |
66.25 |
|
| £50-55K |
1.18% |
1.90% |
61.75 |
|
| £55-60K |
0.85% |
1.47% |
57.77 |
|
| £60-65K |
0.62% |
1.15% |
54.24 |
|
| £65-70K |
0.46% |
0.91% |
51.09 |
|
| £70-75K |
0.35% |
0.72% |
48.27 |
|
| £75-80K |
0.26% |
0.57% |
45.73 |
|
| £80-85K |
0.20% |
0.46% |
43.45 |
|
| £85-90K |
0.15% |
0.37% |
41.38 |
|
| £90-95K |
0.12% |
0.31% |
39.50 |
|
| £95-100K |
0.09% |
0.25% |
37.78 |
|
| £100K + |
0.40% |
1.34% |
29.98 |
|
|
|

|


|
1992-1997
|
1997-2001
|
|
|
|
| Con |
-14.28% |
| Lab |
4.26% |
| LD |
-0.71% |
|
| Con |
7.98% |
| Lab |
-4.16% |
| LD |
2.30% |
|
|
 |
Anthony Steen
Conservative hold
|
| Con |
 |
21,914 |
44.50% |
| Lab |
 |
6,005 |
12.19% |
| LD |
 |
18,317 |
37.19% |
| Oth |
 |
3,010 |
6.11% |
| Maj |
 |
3,597 |
7.30% |
| Turn |
 |
49,246 |
67.88% |
|
|
 |
Anthony Steen
Conservative hold
|
| UK |
Craig Mackinlay |
3,010 |
6.11% |
| LD |
Rachel Oliver |
18,317 |
37.19% |
| C |
Anthony Steen |
21,914 |
44.50% |
| L |
Thomas Wildy |
6,005 |
12.19% |
|
Candidates representing 4 parties stood for election to this seat.
|
|
 |
Anthony Steen
Conservative
|
| Con |
 |
19,637 |
36.52% |
| Lab |
 |
8,796 |
16.36% |
| LD |
 |
18,760 |
34.89% |
| Ref |
 |
2,552 |
4.75% |
| Oth |
 |
4,024 |
7.48% |
| Maj |
 |
877 |
1.63% |
| Turn |
 |
53,769 |
76.30% |
|
|
 |
|
Conservative
|
| Con |
 |
28,736 |
50.80% |
| Lab |
 |
6,842 |
12.10% |
| LD |
 |
20,110 |
35.60% |
| Oth |
 |
853 |
1.50% |
| Maj |
 |
8,626 |
15.30% |
| Turn |
 |
56,541 |
83.06% |
|
|
 |
|

|

