|
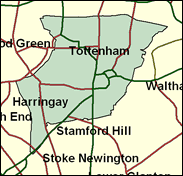
Tottenham
Labour hold

On 22 June 2000 David Lammy became the newest, and indeed the youngest, of the 659 MPs (a role he was to play for just three months) as he was comfortably elected to replace the late Bernie Grant as member for Tottenham. The Conservatives made no progress in this deprived part of London; there seems nothing for them here. The Liberal Democrats increased their share, but only by 8pc, well under their best byelection advances, even in seats Labour are defending. The London Socialist Alliance achieved the five per cent share needed to recover their deposit; but New Labour does not seem threatened from the Left either. Lammy can look forward to becoming a far more senior member of the Commons in more than one sense than he is as yet.

When David Lammy, a high-flying Blairite barrister, was elected at the June 2000 by-election in place of the late Bernie Grant, he ensured that Labour's tally of black and Asian MPs remained at nine, having beaten Grant's white widow for the nomination. Like Grant from a Guyanese background, he was born in July 1972 (making him the new Baby of the House) and educated at King's School, Peterborough, London University and Harvard Law School. He was once frisked by a policeman at the High Court on the assumption he was the accused.
 |
| Wealthy Achievers, Suburban Areas |
0.00% |
14.99% |
0.00 |
|
| Affluent Greys, Rural Communities |
0.00% |
2.13% |
0.00 |
|
| Prosperous Pensioners, Retirement Areas |
0.00% |
2.49% |
0.00 |
|
| Affluent Executives, Family Areas |
0.00% |
4.43% |
0.00 |
|
| Well-Off Workers, Family Areas |
0.00% |
7.27% |
0.00 |
|
| Affluent Urbanites, Town & City Areas |
0.29% |
2.56% |
11.24 |
|
| Prosperous Professionals, Metropolitan Areas |
4.55% |
2.04% |
222.94 |
|
| Better-Off Executives, Inner City Areas |
21.61% |
3.94% |
547.96 |
|
| Comfortable Middle Agers, Mature Home Owning Areas |
0.00% |
13.04% |
0.00 |
|
| Skilled Workers, Home Owning Areas |
0.00% |
12.70% |
0.00 |
|
| New Home Owners, Mature Communities |
0.41% |
8.14% |
4.99 |
|
| White Collar Workers, Better-Off Multi Ethnic Areas |
34.05% |
4.02% |
846.62 |
|
| Older People, Less Prosperous Areas |
0.51% |
3.19% |
16.16 |
|
| Council Estate Residents, Better-Off Homes |
7.28% |
11.31% |
64.33 |
|
| Council Estate Residents, High Unemployment |
7.21% |
3.06% |
235.39 |
|
| Council Estate Residents, Greatest Hardship |
0.61% |
2.52% |
24.31 |
|
| People in Multi-Ethnic, Low-Income Areas |
23.48% |
2.10% |
1,118.32 |
|
| Unclassified |
0.00% |
0.06% |
2.95 |
|
|
 |
 |
 |
| £0-5K |
8.99% |
9.41% |
95.51 |
|
| £5-10K |
15.07% |
16.63% |
90.63 |
|
| £10-15K |
15.46% |
16.58% |
93.25 |
|
| £15-20K |
13.20% |
13.58% |
97.21 |
|
| £20-25K |
10.51% |
10.39% |
101.10 |
|
| £25-30K |
8.13% |
7.77% |
104.53 |
|
| £30-35K |
6.22% |
5.79% |
107.45 |
|
| £35-40K |
4.76% |
4.33% |
109.89 |
|
| £40-45K |
3.65% |
3.27% |
111.90 |
|
| £45-50K |
2.82% |
2.48% |
113.56 |
|
| £50-55K |
2.19% |
1.90% |
114.94 |
|
| £55-60K |
1.71% |
1.47% |
116.08 |
|
| £60-65K |
1.35% |
1.15% |
117.03 |
|
| £65-70K |
1.07% |
0.91% |
117.83 |
|
| £70-75K |
0.85% |
0.72% |
118.50 |
|
| £75-80K |
0.68% |
0.57% |
119.08 |
|
| £80-85K |
0.55% |
0.46% |
119.56 |
|
| £85-90K |
0.45% |
0.37% |
119.99 |
|
| £90-95K |
0.37% |
0.31% |
120.35 |
|
| £95-100K |
0.30% |
0.25% |
120.67 |
|
| £100K + |
1.64% |
1.34% |
122.00 |
|
|
|

|


|
1992-1997
|
1997-2001
|
|
|
|
| Con |
-14.10% |
| Lab |
12.78% |
| LD |
-0.62% |
|
| Con |
-1.78% |
| Lab |
-1.82% |
| LD |
-1.26% |
|
|
 |
David Lammy
Labour hold
|
| Con |
 |
4,401 |
13.93% |
| Lab |
 |
21,317 |
67.46% |
| LD |
 |
3,008 |
9.52% |
| Oth |
 |
2,875 |
9.10% |
| Maj |
 |
16,916 |
53.53% |
| Turn |
 |
31,601 |
48.20% |
|
|
 |
David Lammy
Labour hold
|
| SA |
Weyman Bennett |
1,162 |
3.68% |
| G |
Peter Budge |
1,443 |
4.57% |
| C |
Uma Fernandes |
4,401 |
13.93% |
| LD |
Meher Khan |
3,008 |
9.52% |
| L |
David Lammy |
21,317 |
67.46% |
| Reform |
Unver Shefki |
270 |
0.85% |
|
Candidates representing 6 parties stood for election to this seat.
|
|
 |
|
By Election (22 June 2000)
|
|
Death of Bernard Alexander Montgomery Grant on 8 April 2000
|
David Lammy
Labour
|
| Con |
 |
2,634 |
16.04% |
| Lab |
 |
8,785 |
53.51% |
| LD |
 |
3,139 |
19.12% |
| Oth |
 |
1,859 |
11.32% |
| Maj |
 |
5,646 |
34.39% |
| Turn |
 |
16,417 |
25.43% |
|
|
 |
Bernie Grant
Labour
|
| Con |
 |
5,921 |
15.70% |
| Lab |
 |
26,121 |
69.28% |
| LD |
 |
4,064 |
10.78% |
| Ref |
|
0 |
0.00% |
| Oth |
 |
1,598 |
4.24% |
| Maj |
 |
20,200 |
53.58% |
| Turn |
 |
37,704 |
56.98% |
|
|
 |
|
Labour
|
| Con |
 |
13,341 |
29.80% |
| Lab |
 |
25,309 |
56.50% |
| LD |
 |
5,120 |
11.40% |
| Oth |
 |
1,053 |
2.30% |
| Maj |
 |
11,968 |
26.70% |
| Turn |
 |
44,823 |
63.85% |
|
|
 |
|

|

