|
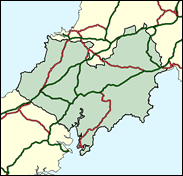
Truro & St Austell
Liberal Democrat hold

Although the Conservatives polled the most votes even here on Euro-election day in June 1999, Truro and St Austell must be regarded as just about the safest Liberal Democrat seat in England. Following the tenure as MP here of the redoubtable David Penhaligon, who was killed in a car crash at the end of 1986 Matthew Taylor can expect a fifth victory here, probably with another five-figure majority, even before his 40th birthday.

Matthew Taylor, Liberal Democrat Treasury spokesman, was elected here in 1987 in succession to the stage Cornishman David Penhaligon, whose parliamentary aide he had been. A tall, monotonous-voiced, frozen-visaged, articulate backer of Ashdown and Kennedy-style Lib-Labbery, he was born in 1963 and educated at University College School, Hampstead and Lady Margaret Hall, Oxford, one of nine Lib Dem MPs with a public school and Oxbridge background. Inevitably a campaigner on "more for Cornwall", he rather over-egged the pudding by entirely mis-predicting a swamping influx of 2 million solar-eclipse-seeking trippers in 1998, but made a more sensible prediction a year later in acting as Charles Kennedy's leadership campaign manager, and getting as his reward the Treasury spokesmanship.
 |
| Wealthy Achievers, Suburban Areas |
14.20% |
14.99% |
94.73 |
|
| Affluent Greys, Rural Communities |
12.96% |
2.13% |
609.34 |
|
| Prosperous Pensioners, Retirement Areas |
9.39% |
2.49% |
377.51 |
|
| Affluent Executives, Family Areas |
1.41% |
4.43% |
31.75 |
|
| Well-Off Workers, Family Areas |
8.07% |
7.27% |
111.00 |
|
| Affluent Urbanites, Town & City Areas |
0.83% |
2.56% |
32.27 |
|
| Prosperous Professionals, Metropolitan Areas |
0.00% |
2.04% |
0.00 |
|
| Better-Off Executives, Inner City Areas |
2.13% |
3.94% |
54.05 |
|
| Comfortable Middle Agers, Mature Home Owning Areas |
22.78% |
13.04% |
174.68 |
|
| Skilled Workers, Home Owning Areas |
9.52% |
12.70% |
74.97 |
|
| New Home Owners, Mature Communities |
9.38% |
8.14% |
115.21 |
|
| White Collar Workers, Better-Off Multi Ethnic Areas |
2.22% |
4.02% |
55.32 |
|
| Older People, Less Prosperous Areas |
2.69% |
3.19% |
84.52 |
|
| Council Estate Residents, Better-Off Homes |
3.72% |
11.31% |
32.85 |
|
| Council Estate Residents, High Unemployment |
0.69% |
3.06% |
22.49 |
|
| Council Estate Residents, Greatest Hardship |
0.00% |
2.52% |
0.00 |
|
| People in Multi-Ethnic, Low-Income Areas |
0.00% |
2.10% |
0.00 |
|
| Unclassified |
0.01% |
0.06% |
20.69 |
|
|
 |
 |
 |
| £0-5K |
11.03% |
9.41% |
117.20 |
|
| £5-10K |
20.32% |
16.63% |
122.19 |
|
| £10-15K |
19.39% |
16.58% |
116.97 |
|
| £15-20K |
14.73% |
13.58% |
108.45 |
|
| £20-25K |
10.33% |
10.39% |
99.36 |
|
| £25-30K |
7.06% |
7.77% |
90.78 |
|
| £30-35K |
4.81% |
5.79% |
83.04 |
|
| £35-40K |
3.30% |
4.33% |
76.21 |
|
| £40-45K |
2.29% |
3.27% |
70.22 |
|
| £45-50K |
1.61% |
2.48% |
64.97 |
|
| £50-55K |
1.15% |
1.90% |
60.37 |
|
| £55-60K |
0.83% |
1.47% |
56.31 |
|
| £60-65K |
0.61% |
1.15% |
52.72 |
|
| £65-70K |
0.45% |
0.91% |
49.54 |
|
| £70-75K |
0.34% |
0.72% |
46.70 |
|
| £75-80K |
0.25% |
0.57% |
44.15 |
|
| £80-85K |
0.19% |
0.46% |
41.86 |
|
| £85-90K |
0.15% |
0.37% |
39.79 |
|
| £90-95K |
0.12% |
0.31% |
37.91 |
|
| £95-100K |
0.09% |
0.25% |
36.20 |
|
| £100K + |
0.38% |
1.34% |
28.52 |
|
|
|

|


|
1992-1997
|
1997-2001
|
|
|
|
| Con |
-11.87% |
| Lab |
5.53% |
| LD |
-2.04% |
|
| Con |
5.84% |
| Lab |
-1.63% |
| LD |
-0.16% |
|
|
 |
Matthew Taylor
Liberal Democrat hold
|
| Con |
 |
16,231 |
32.27% |
| Lab |
 |
6,889 |
13.70% |
| LD |
 |
24,296 |
48.31% |
| Oth |
 |
2,879 |
5.72% |
| Maj |
 |
8,065 |
16.04% |
| Turn |
 |
50,295 |
63.49% |
|
|
 |
Matthew Taylor
Liberal Democrat hold
|
| C |
Tim Bonner |
16,231 |
32.27% |
| MK |
Conan Jemkin |
1,137 |
2.26% |
| I |
John Lee |
78 |
0.16% |
| L |
David Phillips |
6,889 |
13.70% |
| LD |
Matthew Taylor |
24,296 |
48.31% |
| UK |
James Wonnacott |
1,664 |
3.31% |
|
Candidates representing 6 parties stood for election to this seat.
|
|
 |
Matthew Taylor
Liberal Democrat
|
| Con |
 |
15,001 |
26.43% |
| Lab |
 |
8,697 |
15.33% |
| LD |
 |
27,502 |
48.46% |
| Ref |
 |
3,682 |
6.49% |
| Oth |
 |
1,865 |
3.29% |
| Maj |
 |
12,501 |
22.03% |
| Turn |
 |
56,747 |
73.87% |
|
|
 |
|
Liberal Democrat
|
| Con |
 |
23,660 |
38.30% |
| Lab |
 |
6,078 |
9.80% |
| LD |
 |
31,230 |
50.50% |
| Oth |
 |
885 |
1.40% |
| Maj |
 |
7,570 |
12.20% |
| Turn |
 |
61,853 |
81.60% |
|
|
 |
|

|

