|
Tweedale, Ettrick & Lauderdale
Liberal Democrat hold

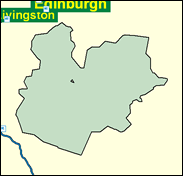
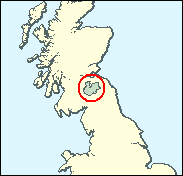
Although Labour advanced into second place, less than 1,500 votes behind David Steel's successor Michael Moore, in 1997, but that is probably as close as they are going to get in this west Borders seat. The Liberal Democrats held this seat in the Scottish Parliament elections two years later with a much more comfortable lead of 4,478, and this over the SNP with Labour just behind in third. With the Conservatives not far behind (though plumb last) the divided opposition should let Moore back even with a share of vote in the low thirties, percentage-wise.

Michael Moore, a Transport spokesman and the political son and heir of David Steel, who shooed him in here after his own 32-year stint, was elected in 1997, one son of the Manse in the steps of another. He is a keen devolutionist who helped broker the Scottish Lab-Lib coalition in 1999 despite having Labour as his own local opponent. Tall, boyish-looking and Ulster-born in 1965, he was educated at fee-paying Strathallan School, Jedburgh Grammar School and Edinburgh University, and worked as an accountant for six years. Notwithstanding his former profession, his role as an assiduous constituency MP involves defence of the local textile industry.
 |
| Wealthy Achievers, Suburban Areas |
13.21% |
14.99% |
88.13 |
|
| Affluent Greys, Rural Communities |
3.89% |
2.13% |
183.08 |
|
| Prosperous Pensioners, Retirement Areas |
3.25% |
2.49% |
130.89 |
|
| Affluent Executives, Family Areas |
2.83% |
4.43% |
63.99 |
|
| Well-Off Workers, Family Areas |
14.06% |
7.27% |
193.34 |
|
| Affluent Urbanites, Town & City Areas |
1.90% |
2.56% |
74.22 |
|
| Prosperous Professionals, Metropolitan Areas |
1.29% |
2.04% |
63.02 |
|
| Better-Off Executives, Inner City Areas |
1.93% |
3.94% |
48.85 |
|
| Comfortable Middle Agers, Mature Home Owning Areas |
7.64% |
13.04% |
58.62 |
|
| Skilled Workers, Home Owning Areas |
5.48% |
12.70% |
43.17 |
|
| New Home Owners, Mature Communities |
6.36% |
8.14% |
78.06 |
|
| White Collar Workers, Better-Off Multi Ethnic Areas |
1.93% |
4.02% |
48.02 |
|
| Older People, Less Prosperous Areas |
7.31% |
3.19% |
229.36 |
|
| Council Estate Residents, Better-Off Homes |
23.14% |
11.31% |
204.58 |
|
| Council Estate Residents, High Unemployment |
4.91% |
3.06% |
160.38 |
|
| Council Estate Residents, Greatest Hardship |
0.81% |
2.52% |
32.04 |
|
| People in Multi-Ethnic, Low-Income Areas |
0.00% |
2.10% |
0.00 |
|
| Unclassified |
0.05% |
0.06% |
78.61 |
|
|
 |
 |
 |
| £0-5K |
9.14% |
9.41% |
97.14 |
|
| £5-10K |
17.22% |
16.63% |
103.51 |
|
| £10-15K |
17.39% |
16.58% |
104.89 |
|
| £15-20K |
14.17% |
13.58% |
104.29 |
|
| £20-25K |
10.69% |
10.39% |
102.82 |
|
| £25-30K |
7.85% |
7.77% |
100.96 |
|
| £30-35K |
5.73% |
5.79% |
98.94 |
|
| £35-40K |
4.20% |
4.33% |
96.90 |
|
| £40-45K |
3.10% |
3.27% |
94.90 |
|
| £45-50K |
2.31% |
2.48% |
92.98 |
|
| £50-55K |
1.74% |
1.90% |
91.16 |
|
| £55-60K |
1.32% |
1.47% |
89.45 |
|
| £60-65K |
1.01% |
1.15% |
87.84 |
|
| £65-70K |
0.78% |
0.91% |
86.33 |
|
| £70-75K |
0.61% |
0.72% |
84.92 |
|
| £75-80K |
0.48% |
0.57% |
83.60 |
|
| £80-85K |
0.38% |
0.46% |
82.36 |
|
| £85-90K |
0.30% |
0.37% |
81.19 |
|
| £90-95K |
0.24% |
0.31% |
80.10 |
|
| £95-100K |
0.20% |
0.25% |
79.07 |
|
| £100K + |
0.99% |
1.34% |
73.60 |
|
|
|

|


|
1992-1997
|
1997-2001
|
|
|
|
| Con |
-8.59% |
| Lab |
11.01% |
| LD |
-3.78% |
| SNP |
-0.10% |
|
| Con |
-6.70% |
| Lab |
-0.68% |
| LD |
11.03% |
| SNP |
-4.74% |
|
|
 |
Michael Moore
Liberal Democrat hold
|
| Con |
 |
5,118 |
15.41% |
| Lab |
 |
8,878 |
26.73% |
| LD |
 |
14,035 |
42.25% |
| SNP |
 |
4,108 |
12.37% |
| Oth |
 |
1,078 |
3.25% |
| Maj |
 |
5,157 |
15.53% |
| Turn |
 |
33,217 |
63.92% |
|
|
 |
Michael Moore
Liberal Democrat hold
|
| C |
Andrew Brocklehurst |
5,118 |
15.41% |
| L |
Keith Geddes |
8,878 |
26.73% |
| Lib |
John Hein |
383 |
1.15% |
| SSP |
Norman Lockhart |
695 |
2.09% |
| LD |
Michael Moore |
14,035 |
42.25% |
| SNP |
Richard Thomas |
4,108 |
12.37% |
|
Candidates representing 6 parties stood for election to this seat.
|
|
 |
Michael Moore
Liberal Democrat
|
| Con |
 |
8,623 |
22.11% |
| Lab |
 |
10,689 |
27.41% |
| LD |
 |
12,178 |
31.22% |
| SNP |
 |
6,671 |
17.10% |
| Ref |
 |
406 |
1.04% |
| Oth |
 |
434 |
1.11% |
| Maj |
 |
1,489 |
3.82% |
| Turn |
 |
39,001 |
76.64% |
|
|
 |
|
Liberal Democrat
|
| Con |
 |
12,218 |
30.70% |
| Lab |
 |
6,538 |
16.40% |
| LD |
 |
13,953 |
35.00% |
| SNP |
 |
6,835 |
17.20% |
| Oth |
 |
276 |
0.70% |
| Maj |
 |
1,735 |
4.40% |
| Turn |
 |
39,820 |
79.28% |
|
|
 |
|

|

