|
Tyne Bridge
Labour hold

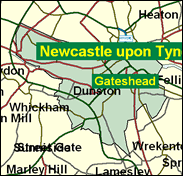
The seat which crosses the Tyne to combine the very heart of Newcastle with the centre of Gateshead is, as one might expect, one of the five safest Labour seats in England. Besides the vibrant downtown of the Geordie capital, it also includes some of the most blighted territory anywhere in Britain, in the depressed west end, in Benwell, Elswick and Scotswood. It has the highest unemployment and the highest percentage of council tenants in the North East, and a small and much abused Bangladeshi community, and only one per cent detached houses, also the fewest anywhere in the region. This is indeed a place of many trials.

As Assistant Whip since 1997 - in opposition as well as in government - David Clelland is one of Labour's shrinking group of working class trade unionists. He is formerly an electrical tester and AEEU shop steward at NEI in Gateshead, where he was eventually made redundant after 21 years. Born 1943, he attended Kelvin Grove Boys' School, Gateshead and local technical colleges. Elected in 1985, he owed his selection for the seat to his leadership of Gateshead Council and his family's friendship with the deceased MP Harry Cowans. A short and cheery pipe-smoking Geordie, he has been an assiduous representative of North East regional concerns, and notably of his local armaments factory.
 |
| Wealthy Achievers, Suburban Areas |
0.55% |
14.99% |
3.64 |
|
| Affluent Greys, Rural Communities |
0.00% |
2.13% |
0.00 |
|
| Prosperous Pensioners, Retirement Areas |
0.00% |
2.49% |
0.00 |
|
| Affluent Executives, Family Areas |
0.19% |
4.43% |
4.38 |
|
| Well-Off Workers, Family Areas |
1.15% |
7.27% |
15.74 |
|
| Affluent Urbanites, Town & City Areas |
0.61% |
2.56% |
23.95 |
|
| Prosperous Professionals, Metropolitan Areas |
0.00% |
2.04% |
0.00 |
|
| Better-Off Executives, Inner City Areas |
5.55% |
3.94% |
140.80 |
|
| Comfortable Middle Agers, Mature Home Owning Areas |
4.91% |
13.04% |
37.63 |
|
| Skilled Workers, Home Owning Areas |
12.41% |
12.70% |
97.72 |
|
| New Home Owners, Mature Communities |
8.92% |
8.14% |
109.48 |
|
| White Collar Workers, Better-Off Multi Ethnic Areas |
3.12% |
4.02% |
77.69 |
|
| Older People, Less Prosperous Areas |
8.92% |
3.19% |
280.17 |
|
| Council Estate Residents, Better-Off Homes |
22.19% |
11.31% |
196.23 |
|
| Council Estate Residents, High Unemployment |
18.59% |
3.06% |
606.96 |
|
| Council Estate Residents, Greatest Hardship |
10.15% |
2.52% |
402.99 |
|
| People in Multi-Ethnic, Low-Income Areas |
2.72% |
2.10% |
129.34 |
|
| Unclassified |
0.02% |
0.06% |
30.55 |
|
|
 |
 |
 |
| £0-5K |
16.75% |
9.41% |
177.98 |
|
| £5-10K |
24.67% |
16.63% |
148.34 |
|
| £10-15K |
20.11% |
16.58% |
121.30 |
|
| £15-20K |
13.57% |
13.58% |
99.93 |
|
| £20-25K |
8.66% |
10.39% |
83.33 |
|
| £25-30K |
5.47% |
7.77% |
70.37 |
|
| £30-35K |
3.48% |
5.79% |
60.12 |
|
| £35-40K |
2.25% |
4.33% |
51.94 |
|
| £40-45K |
1.48% |
3.27% |
45.34 |
|
| £45-50K |
0.99% |
2.48% |
39.95 |
|
| £50-55K |
0.68% |
1.90% |
35.51 |
|
| £55-60K |
0.47% |
1.47% |
31.81 |
|
| £60-65K |
0.33% |
1.15% |
28.71 |
|
| £65-70K |
0.24% |
0.91% |
26.08 |
|
| £70-75K |
0.17% |
0.72% |
23.85 |
|
| £75-80K |
0.13% |
0.57% |
21.92 |
|
| £80-85K |
0.09% |
0.46% |
20.26 |
|
| £85-90K |
0.07% |
0.37% |
18.81 |
|
| £90-95K |
0.05% |
0.31% |
17.55 |
|
| £95-100K |
0.04% |
0.25% |
16.43 |
|
| £100K + |
0.16% |
1.34% |
12.02 |
|
|
|

|


|
1992-1997
|
1997-2001
|
|
|
|
| Con |
-11.02% |
| Lab |
10.01% |
| LD |
-3.11% |
|
| Con |
2.20% |
| Lab |
-6.34% |
| LD |
4.35% |
|
|
 |
David Clelland
Labour hold
|
| Con |
 |
3,456 |
13.28% |
| Lab |
 |
18,345 |
70.47% |
| LD |
 |
3,213 |
12.34% |
| Oth |
 |
1,018 |
3.91% |
| Maj |
 |
14,889 |
57.19% |
| Turn |
 |
26,032 |
44.20% |
|
|
 |
David Clelland
Labour hold
|
| L |
David Clelland |
18,345 |
70.47% |
| C |
James Cook |
3,456 |
13.28% |
| SL |
James Fitzpatrick |
533 |
2.05% |
| SA |
Samuel Robson |
485 |
1.86% |
| LD |
Jonathan Wallace |
3,213 |
12.34% |
|
Candidates representing 5 parties stood for election to this seat.
|
|
 |
David Clelland
Labour
|
| Con |
 |
3,861 |
11.08% |
| Lab |
 |
26,767 |
76.81% |
| LD |
 |
2,785 |
7.99% |
| Ref |
 |
919 |
2.64% |
| Oth |
 |
518 |
1.49% |
| Maj |
 |
22,906 |
65.73% |
| Turn |
 |
34,850 |
57.08% |
|
|
 |
|
Labour
|
| Con |
 |
9,443 |
22.10% |
| Lab |
 |
28,520 |
66.80% |
| LD |
 |
4,755 |
11.10% |
| Oth |
|
0 |
0.00% |
| Maj |
 |
19,077 |
44.70% |
| Turn |
 |
42,718 |
63.68% |
|
|
 |
|

|

