|
Tynemouth
Labour hold

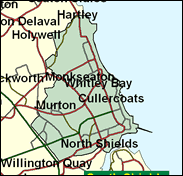
It is amazing to think that this north eastern seat was held by the Conservatives, in the formidable shape of Dame Irene Ward, even in 1966 when Labour won an overall majority of 100. They may well match this national showing next time, but if so Alan Campbell should be returned; the Tories have done very well in local elections for North Tyneside council recently, in wards such as Monkseaton and Seatonville, Tynemouth, St Mary's and Whitley Bay, but in this case that may well be a result of municipal factors.

Alan Campbell won the seat for Labour in 1997. He is a schoolteacher born in 1957, educated at Blackfyne Secondary School, Consett and at Lancaster, Leeds and Newcastle Universities. No great troubler of the scorers, he has focused on local concerns and on the importance of European funding, and expressed reservations about moves towards PR voting.
 |
| Wealthy Achievers, Suburban Areas |
18.78% |
14.99% |
125.22 |
|
| Affluent Greys, Rural Communities |
0.00% |
2.13% |
0.00 |
|
| Prosperous Pensioners, Retirement Areas |
2.26% |
2.49% |
91.07 |
|
| Affluent Executives, Family Areas |
1.16% |
4.43% |
26.13 |
|
| Well-Off Workers, Family Areas |
0.77% |
7.27% |
10.54 |
|
| Affluent Urbanites, Town & City Areas |
3.77% |
2.56% |
146.94 |
|
| Prosperous Professionals, Metropolitan Areas |
1.58% |
2.04% |
77.22 |
|
| Better-Off Executives, Inner City Areas |
1.10% |
3.94% |
27.95 |
|
| Comfortable Middle Agers, Mature Home Owning Areas |
19.62% |
13.04% |
150.48 |
|
| Skilled Workers, Home Owning Areas |
6.69% |
12.70% |
52.65 |
|
| New Home Owners, Mature Communities |
10.57% |
8.14% |
129.80 |
|
| White Collar Workers, Better-Off Multi Ethnic Areas |
10.13% |
4.02% |
251.79 |
|
| Older People, Less Prosperous Areas |
10.32% |
3.19% |
323.84 |
|
| Council Estate Residents, Better-Off Homes |
7.46% |
11.31% |
65.94 |
|
| Council Estate Residents, High Unemployment |
2.53% |
3.06% |
82.58 |
|
| Council Estate Residents, Greatest Hardship |
3.27% |
2.52% |
129.67 |
|
| People in Multi-Ethnic, Low-Income Areas |
0.00% |
2.10% |
0.00 |
|
| Unclassified |
0.02% |
0.06% |
25.71 |
|
|
 |
 |
 |
| £0-5K |
10.46% |
9.41% |
111.17 |
|
| £5-10K |
17.56% |
16.63% |
105.57 |
|
| £10-15K |
17.00% |
16.58% |
102.52 |
|
| £15-20K |
13.64% |
13.58% |
100.45 |
|
| £20-25K |
10.27% |
10.39% |
98.81 |
|
| £25-30K |
7.57% |
7.77% |
97.40 |
|
| £30-35K |
5.57% |
5.79% |
96.14 |
|
| £35-40K |
4.12% |
4.33% |
94.98 |
|
| £40-45K |
3.07% |
3.27% |
93.89 |
|
| £45-50K |
2.31% |
2.48% |
92.87 |
|
| £50-55K |
1.75% |
1.90% |
91.88 |
|
| £55-60K |
1.34% |
1.47% |
90.94 |
|
| £60-65K |
1.04% |
1.15% |
90.01 |
|
| £65-70K |
0.81% |
0.91% |
89.11 |
|
| £70-75K |
0.63% |
0.72% |
88.23 |
|
| £75-80K |
0.50% |
0.57% |
87.35 |
|
| £80-85K |
0.40% |
0.46% |
86.49 |
|
| £85-90K |
0.32% |
0.37% |
85.64 |
|
| £90-95K |
0.26% |
0.31% |
84.79 |
|
| £95-100K |
0.21% |
0.25% |
83.95 |
|
| £100K + |
1.05% |
1.34% |
78.12 |
|
|
|

|


|
1992-1997
|
1997-2001
|
|
|
|
| Con |
-15.28% |
| Lab |
13.06% |
| LD |
0.71% |
|
| Con |
0.13% |
| Lab |
-2.14% |
| LD |
2.82% |
|
|
 |
Alan Campbell
Labour hold
|
| Con |
 |
14,686 |
33.45% |
| Lab |
 |
23,364 |
53.22% |
| LD |
 |
5,108 |
11.63% |
| Oth |
 |
745 |
1.70% |
| Maj |
 |
8,678 |
19.77% |
| Turn |
 |
43,903 |
67.35% |
|
|
 |
Alan Campbell
Labour hold
|
| L |
Alan Campbell |
23,364 |
53.22% |
| C |
Karl Poulsen |
14,686 |
33.45% |
| LD |
Penny Reid |
5,108 |
11.63% |
| UK |
Michael Rollings |
745 |
1.70% |
|
Candidates representing 4 parties stood for election to this seat.
|
|
 |
Alan Campbell
Labour gain
|
| Con |
 |
17,045 |
33.32% |
| Lab |
 |
28,318 |
55.36% |
| LD |
 |
4,509 |
8.81% |
| Ref |
 |
819 |
1.60% |
| Oth |
 |
462 |
0.90% |
| Maj |
 |
11,273 |
22.04% |
| Turn |
 |
51,153 |
77.11% |
|
|
 |
|
Conservative
|
| Con |
 |
27,056 |
48.60% |
| Lab |
 |
23,527 |
42.30% |
| LD |
 |
4,507 |
8.10% |
| Oth |
 |
543 |
1.00% |
| Maj |
 |
3,529 |
6.30% |
| Turn |
 |
55,633 |
81.08% |
|
|
 |
|

|

