|
Tyneside North
Labour hold

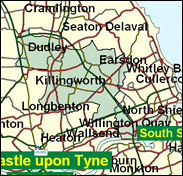
Stephen Byers, who has forced his way into a high-profile role in the Cabinet since the Labour government was elected in 1997, has an ultra safe seat on the north bank of the Tyne east of Newcastle, and some miles inland, covering North Shields, Longbenton and the fortress-like Killingworth Township. It is a fitting platform from which his ambition may vault.

Stephen Byers, Trade & Industry Secretary, has enjoyed a meteoric rise since his election in 1992, assisted no doubt by the airbrushing of his moustache in 1995 - contemporaneously with Peter Mandelson. A sometime Bennite and a local polytechnic lecturer, he was born in 1953 and attended a grammar school and FE college in Chester and Liverpool Polytechnic. A Gould, not Smith, voter in 1992, he moved significantly in a Blairite direction in provocatively calling during the 1996 TUC Congress for looser Labour links with the unions, and as DTI Secretary has managed to deflect blame for major car and steelworks closures onto duplicitous foreigners. As schools standards minister in 1998 he failed the Dan Quayle test when answering "54" to the question "What is 7 times 8?" That aside, he is clearly one of Tony Blair's effortlessly rising suits - the face of New Labour managerial competence.
 |
| Wealthy Achievers, Suburban Areas |
2.42% |
14.99% |
16.12 |
|
| Affluent Greys, Rural Communities |
0.00% |
2.13% |
0.00 |
|
| Prosperous Pensioners, Retirement Areas |
0.16% |
2.49% |
6.54 |
|
| Affluent Executives, Family Areas |
2.43% |
4.43% |
54.95 |
|
| Well-Off Workers, Family Areas |
8.29% |
7.27% |
113.98 |
|
| Affluent Urbanites, Town & City Areas |
0.94% |
2.56% |
36.80 |
|
| Prosperous Professionals, Metropolitan Areas |
0.00% |
2.04% |
0.00 |
|
| Better-Off Executives, Inner City Areas |
0.00% |
3.94% |
0.00 |
|
| Comfortable Middle Agers, Mature Home Owning Areas |
12.72% |
13.04% |
97.53 |
|
| Skilled Workers, Home Owning Areas |
8.77% |
12.70% |
69.06 |
|
| New Home Owners, Mature Communities |
21.84% |
8.14% |
268.25 |
|
| White Collar Workers, Better-Off Multi Ethnic Areas |
0.00% |
4.02% |
0.00 |
|
| Older People, Less Prosperous Areas |
7.71% |
3.19% |
241.93 |
|
| Council Estate Residents, Better-Off Homes |
25.68% |
11.31% |
227.06 |
|
| Council Estate Residents, High Unemployment |
6.07% |
3.06% |
198.17 |
|
| Council Estate Residents, Greatest Hardship |
2.96% |
2.52% |
117.68 |
|
| People in Multi-Ethnic, Low-Income Areas |
0.00% |
2.10% |
0.00 |
|
| Unclassified |
0.00% |
0.06% |
0.00 |
|
|
 |
 |
 |
| £0-5K |
12.61% |
9.41% |
133.95 |
|
| £5-10K |
21.80% |
16.63% |
131.07 |
|
| £10-15K |
19.53% |
16.58% |
117.79 |
|
| £15-20K |
14.23% |
13.58% |
104.74 |
|
| £20-25K |
9.74% |
10.39% |
93.68 |
|
| £25-30K |
6.57% |
7.77% |
84.48 |
|
| £30-35K |
4.45% |
5.79% |
76.75 |
|
| £35-40K |
3.04% |
4.33% |
70.18 |
|
| £40-45K |
2.11% |
3.27% |
64.53 |
|
| £45-50K |
1.48% |
2.48% |
59.62 |
|
| £50-55K |
1.05% |
1.90% |
55.33 |
|
| £55-60K |
0.76% |
1.47% |
51.54 |
|
| £60-65K |
0.55% |
1.15% |
48.19 |
|
| £65-70K |
0.41% |
0.91% |
45.21 |
|
| £70-75K |
0.31% |
0.72% |
42.54 |
|
| £75-80K |
0.23% |
0.57% |
40.14 |
|
| £80-85K |
0.18% |
0.46% |
37.97 |
|
| £85-90K |
0.13% |
0.37% |
36.00 |
|
| £90-95K |
0.10% |
0.31% |
34.21 |
|
| £95-100K |
0.08% |
0.25% |
32.58 |
|
| £100K + |
0.34% |
1.34% |
25.16 |
|
|
|

|


|
1992-1997
|
1997-2001
|
|
|
|
| Con |
-12.33% |
| Lab |
11.72% |
| LD |
-2.45% |
|
| Con |
0.86% |
| Lab |
-3.17% |
| LD |
1.82% |
|
|
 |
Stephen Byers
Labour hold
|
| Con |
 |
5,459 |
14.53% |
| Lab |
 |
26,127 |
69.54% |
| LD |
 |
4,649 |
12.37% |
| Oth |
 |
1,334 |
3.55% |
| Maj |
 |
20,668 |
55.01% |
| Turn |
 |
37,569 |
57.88% |
|
|
 |
Stephen Byers
Labour hold
|
| SA |
Pete Burnett |
324 |
0.86% |
| L |
Stephen Byers |
26,127 |
69.54% |
| SL |
Ken Capstick |
240 |
0.64% |
| LD |
Simon Reed |
4,649 |
12.37% |
| C |
Mark Ruffell |
5,459 |
14.53% |
| UK |
Alan Taylor |
770 |
2.05% |
|
Candidates representing 6 parties stood for election to this seat.
|
|
 |
Stephen Byers
Labour
|
| Con |
 |
6,167 |
13.67% |
| Lab |
 |
32,810 |
72.72% |
| LD |
 |
4,762 |
10.55% |
| Ref |
 |
1,382 |
3.06% |
| Oth |
|
0 |
0.00% |
| Maj |
 |
26,643 |
59.05% |
| Turn |
 |
45,121 |
67.90% |
|
|
 |
|
Labour
|
| Con |
 |
13,130 |
26.00% |
| Lab |
 |
30,764 |
61.00% |
| LD |
 |
6,580 |
13.00% |
| Oth |
|
0 |
0.00% |
| Maj |
 |
17,634 |
34.90% |
| Turn |
 |
50,474 |
73.83% |
|
|
 |
|

|

