|
Upminster
Conservative gain

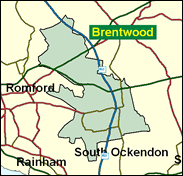
One of three seats in the outer east London (some would say effectively Essex) Borough of Havering that the Tories are desperate to recover, Upminster has always been regarded as in the middle politically between Romford (best for the Conservatives) and Hornchurch (worst). So it was in 1997 and again in the 1999 Euro-elections (the borough council contests are distorted by the most successful Residents candidates anywhere in Greater London). Let's put it this way. If Angela Watkinson does not beat Keith Darvill in 2001 Labour are likely to enjoy an overall majority of at least 110, which would be their third best result ever, and two wins in succession with a three-figure predominance. There would be much moaning, gnashing of teeth, and sharpening of knives in the Conservative hierarchy.

Keith Darvill, Labour's unexpected winner here in 1997, is a self-made solicitor from an East End secondary modern and technical college background, who attended Central London Polytechnic and Chester Law College. Orthodox and inconspicuous, he tabled three written questions in his first year in the Commons. His Conservative opponent is Angela Watkinson, coming very late to the fray at the age of 59. A former bank clerk, special school secretary and local government officer, she was born in Leytonstone in 1941 and attended Wanstead County High School. With political experience limited to serving on (local) Havering and Essex County Councils, she cuts an ordinary dash compared to the young venture capitalists and accountants among Tory candidates, but she is the fourth most likely new female Conservative MP and would serve as a sexagenarian replacement for Teresa Gorman.
 |
| Wealthy Achievers, Suburban Areas |
23.53% |
14.99% |
156.92 |
|
| Affluent Greys, Rural Communities |
0.00% |
2.13% |
0.00 |
|
| Prosperous Pensioners, Retirement Areas |
0.88% |
2.49% |
35.27 |
|
| Affluent Executives, Family Areas |
0.00% |
4.43% |
0.00 |
|
| Well-Off Workers, Family Areas |
0.98% |
7.27% |
13.49 |
|
| Affluent Urbanites, Town & City Areas |
2.38% |
2.56% |
92.87 |
|
| Prosperous Professionals, Metropolitan Areas |
0.79% |
2.04% |
38.52 |
|
| Better-Off Executives, Inner City Areas |
0.19% |
3.94% |
4.91 |
|
| Comfortable Middle Agers, Mature Home Owning Areas |
27.63% |
13.04% |
211.94 |
|
| Skilled Workers, Home Owning Areas |
7.41% |
12.70% |
58.37 |
|
| New Home Owners, Mature Communities |
14.77% |
8.14% |
181.38 |
|
| White Collar Workers, Better-Off Multi Ethnic Areas |
0.03% |
4.02% |
0.81 |
|
| Older People, Less Prosperous Areas |
5.28% |
3.19% |
165.69 |
|
| Council Estate Residents, Better-Off Homes |
11.75% |
11.31% |
103.84 |
|
| Council Estate Residents, High Unemployment |
2.86% |
3.06% |
93.56 |
|
| Council Estate Residents, Greatest Hardship |
1.51% |
2.52% |
60.02 |
|
| People in Multi-Ethnic, Low-Income Areas |
0.00% |
2.10% |
0.00 |
|
| Unclassified |
0.00% |
0.06% |
0.00 |
|
|
 |
 |
 |
| £0-5K |
7.73% |
9.41% |
82.15 |
|
| £5-10K |
13.36% |
16.63% |
80.31 |
|
| £10-15K |
14.15% |
16.58% |
85.34 |
|
| £15-20K |
12.54% |
13.58% |
92.33 |
|
| £20-25K |
10.37% |
10.39% |
99.81 |
|
| £25-30K |
8.33% |
7.77% |
107.16 |
|
| £30-35K |
6.61% |
5.79% |
114.12 |
|
| £35-40K |
5.22% |
4.33% |
120.55 |
|
| £40-45K |
4.13% |
3.27% |
126.43 |
|
| £45-50K |
3.27% |
2.48% |
131.74 |
|
| £50-55K |
2.60% |
1.90% |
136.51 |
|
| £55-60K |
2.08% |
1.47% |
140.78 |
|
| £60-65K |
1.66% |
1.15% |
144.58 |
|
| £65-70K |
1.34% |
0.91% |
147.96 |
|
| £70-75K |
1.09% |
0.72% |
150.95 |
|
| £75-80K |
0.88% |
0.57% |
153.59 |
|
| £80-85K |
0.72% |
0.46% |
155.92 |
|
| £85-90K |
0.59% |
0.37% |
157.96 |
|
| £90-95K |
0.49% |
0.31% |
159.75 |
|
| £95-100K |
0.40% |
0.25% |
161.32 |
|
| £100K + |
2.23% |
1.34% |
165.83 |
|
|
|

|


|
1992-1997
|
1997-2001
|
|
|
|
| Con |
-14.71% |
| Lab |
16.09% |
| LD |
-6.22% |
|
| Con |
6.04% |
| Lab |
-4.33% |
| LD |
-0.08% |
|
|
 |
Angela Watkinson
Conservative gain
|
| Con |
 |
15,410 |
45.52% |
| Lab |
 |
14,169 |
41.86% |
| LD |
 |
3,183 |
9.40% |
| Oth |
 |
1,089 |
3.22% |
| Maj |
 |
1,241 |
3.67% |
| Turn |
 |
33,851 |
59.57% |
|
|
 |
Angela Watkinson
Conservative gain
|
| L |
Keith Darvill |
14,169 |
41.86% |
| UK |
Terry Murray |
1,089 |
3.22% |
| LD |
Peter Truesdale |
3,183 |
9.40% |
| C |
Angela Watkinson |
15,410 |
45.52% |
|
Candidates representing 4 parties stood for election to this seat.
|
|
 |
Keith Darvil
Labour gain
|
| Con |
 |
16,315 |
39.49% |
| Lab |
 |
19,085 |
46.19% |
| LD |
 |
3,919 |
9.48% |
| Ref |
 |
2,000 |
4.84% |
| Oth |
|
0 |
0.00% |
| Maj |
 |
2,770 |
6.70% |
| Turn |
 |
41,319 |
72.30% |
|
|
 |
|
Conservative
|
| Con |
 |
25,121 |
54.20% |
| Lab |
 |
13,964 |
30.10% |
| LD |
 |
7,300 |
15.70% |
| Oth |
|
0 |
0.00% |
| Maj |
 |
11,157 |
24.10% |
| Turn |
 |
46,385 |
79.22% |
|
|
 |
|

|

