|
Vale of Clwyd
Labour hold

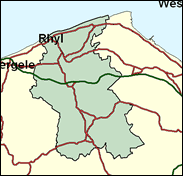
Although technically a Labour gain in 1997, this new seat was not one of their surprise victories, and Chris Ruane is very likely to win again with some ease over Brendan Murphy, who did not succeed in holding Hazel Grove for the Tories on Tom Arnold's retirement in 1997, and may expect more disappointment here in the English speaking part of North Wales. The seat includes a variety of constituent elements. There are the seaside towns of Rhyl and Prestatyn on the flat north coast, the small cathedral town of St Asaph which like all other Welsh candidates was denied in its bold bid for city status in the millennium elevations of December 2000 (it must now wait for the Queen's Golden Jubilee on the throne in 2002), and the inland hill farming territory around the old county town of Denbigh. Labour were 15pc ahead of the Tories here in the Welsh Assembly election of May 1999, and even if the 7pc movement away from them since the May 1997 General Election that this represents were extrapolated to May 2001 (and there is no reason why it should) this would not be enough to dislodge Ruane. This seat brought a new meaning to the phrase "election battle" on May 16 when Deputy Prime Minister John Prescott scrapped with a protester in Rhyl in full view of the national media. But Labour is unlikely to come out second best in the electoral fight in the Vale on June 7.

Chris Ruane, a bland-looking, oval-faced, locally born-and-bred Catholic school teacher, won the seat in 1997. Born 1958, educated at Blessed Edward Jones High School, Rhyl and Aberystwyth and Liverpool Universities and at South Wales Polytechnic, he returned in 1982 to teach, until elected in 1997, at the primary school he had attended in the 1960s. Reliant on notes when speaking, he extols cycling, has attacked local environmental pollution and backed Welsh devolution as promising the "last Quango in Powys".
 |
| Wealthy Achievers, Suburban Areas |
15.11% |
14.99% |
100.75 |
|
| Affluent Greys, Rural Communities |
1.20% |
2.13% |
56.58 |
|
| Prosperous Pensioners, Retirement Areas |
17.77% |
2.49% |
714.69 |
|
| Affluent Executives, Family Areas |
0.27% |
4.43% |
6.21 |
|
| Well-Off Workers, Family Areas |
3.81% |
7.27% |
52.31 |
|
| Affluent Urbanites, Town & City Areas |
2.13% |
2.56% |
82.99 |
|
| Prosperous Professionals, Metropolitan Areas |
0.06% |
2.04% |
2.79 |
|
| Better-Off Executives, Inner City Areas |
3.73% |
3.94% |
94.52 |
|
| Comfortable Middle Agers, Mature Home Owning Areas |
23.97% |
13.04% |
183.85 |
|
| Skilled Workers, Home Owning Areas |
4.94% |
12.70% |
38.86 |
|
| New Home Owners, Mature Communities |
10.96% |
8.14% |
134.64 |
|
| White Collar Workers, Better-Off Multi Ethnic Areas |
4.51% |
4.02% |
112.21 |
|
| Older People, Less Prosperous Areas |
3.17% |
3.19% |
99.54 |
|
| Council Estate Residents, Better-Off Homes |
5.67% |
11.31% |
50.09 |
|
| Council Estate Residents, High Unemployment |
0.04% |
3.06% |
1.43 |
|
| Council Estate Residents, Greatest Hardship |
2.66% |
2.52% |
105.75 |
|
| People in Multi-Ethnic, Low-Income Areas |
0.00% |
2.10% |
0.00 |
|
| Unclassified |
0.00% |
0.06% |
0.00 |
|
|
 |
 |
 |
| £0-5K |
12.49% |
9.41% |
132.70 |
|
| £5-10K |
20.90% |
16.63% |
125.63 |
|
| £10-15K |
19.06% |
16.58% |
114.94 |
|
| £15-20K |
14.17% |
13.58% |
104.31 |
|
| £20-25K |
9.86% |
10.39% |
94.84 |
|
| £25-30K |
6.74% |
7.77% |
86.70 |
|
| £30-35K |
4.62% |
5.79% |
79.77 |
|
| £35-40K |
3.20% |
4.33% |
73.87 |
|
| £40-45K |
2.25% |
3.27% |
68.85 |
|
| £45-50K |
1.60% |
2.48% |
64.53 |
|
| £50-55K |
1.16% |
1.90% |
60.80 |
|
| £55-60K |
0.85% |
1.47% |
57.57 |
|
| £60-65K |
0.63% |
1.15% |
54.73 |
|
| £65-70K |
0.47% |
0.91% |
52.24 |
|
| £70-75K |
0.36% |
0.72% |
50.03 |
|
| £75-80K |
0.28% |
0.57% |
48.06 |
|
| £80-85K |
0.21% |
0.46% |
46.29 |
|
| £85-90K |
0.17% |
0.37% |
44.70 |
|
| £90-95K |
0.13% |
0.31% |
43.26 |
|
| £95-100K |
0.10% |
0.25% |
41.94 |
|
| £100K + |
0.48% |
1.34% |
35.93 |
|
|
|

|


|
1992-1997
|
1997-2001
|
|
|
|
| Con |
-13.90% |
| Lab |
13.89% |
| LD |
-3.65% |
| PC |
1.08% |
|
| Con |
2.41% |
| Lab |
-2.67% |
| LD |
0.70% |
| PC |
1.23% |
|
|
 |
Chris Ruane
Labour hold
|
| Con |
 |
10,418 |
32.21% |
| Lab |
 |
16,179 |
50.02% |
| LD |
 |
3,058 |
9.45% |
| PC |
 |
2,300 |
7.11% |
| Oth |
 |
391 |
1.21% |
| Maj |
 |
5,761 |
17.81% |
| Turn |
 |
32,346 |
63.12% |
|
|
 |
Chris Ruane
Labour hold
|
| UK |
William Campbell |
391 |
1.21% |
| C |
Brendan Murphy |
10,418 |
32.21% |
| PC |
John Penri Williams |
2,300 |
7.11% |
| LD |
Graham Rees |
3,058 |
9.45% |
| L |
Chris Ruane |
16,179 |
50.02% |
|
Candidates representing 5 parties stood for election to this seat.
|
|
 |
Chris Ruane
Labour gain
|
| Con |
 |
11,662 |
29.80% |
| Lab |
 |
20,617 |
52.69% |
| LD |
 |
3,425 |
8.75% |
| PC |
 |
2,301 |
5.88% |
| Ref |
 |
834 |
2.13% |
| Oth |
 |
293 |
0.75% |
| Maj |
 |
8,955 |
22.88% |
| Turn |
 |
39,132 |
74.65% |
|
|
 |
|
Conservative
|
| Con |
 |
19,118 |
43.70% |
| Lab |
 |
16,941 |
38.80% |
| LD |
 |
5,435 |
12.40% |
| PC |
 |
2,095 |
4.80% |
| Oth |
 |
123 |
0.30% |
| Maj |
 |
2,177 |
5.00% |
| Turn |
 |
43,712 |
82.46% |
|
|
 |
|

|

