|
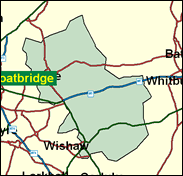
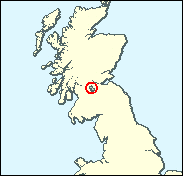
Airdrie & Shotts
Labour hold

This seat is best known as the successor to Monklands East, held by the Labour leader John Smith until his sudden death in 1994. The subsequent by-election was won by Labour's Helen Liddell against the SNP by less than 5pc on a remarkably high 70pc turnout (the date was 30 June, so some potential voters must have been on holiday too). Yet this was the high-water mark of the SNP surge, as they fell back in both 1997 and in the Scottish Parliament elections of 1999 and Helen Liddell's now looks like one of the safest Labour seats in Scotland. This is no surprise, as according to the last available national Census (1991) Airdrie and Shotts has the highest percentage of council housing of any seat in Britain - 62.5pc - and this after the sell-offs of the 1980s. Local authority housing tenure is an even better predictor of Labour support than socio-economic class, and it has always been at its highest proportion in Scotland; 12 of the top 20 counci

The career of Labourís Helen Liddell, promoted to the Cabinet as Scottish Secretary in the wake of Peter Mandelsonís second going in January 2001, had been somewhat becalmed following her earlier failure to land the Scottish job. Variously dubbed ìa cross between Miss Jean Brodie and Luluî and ìStalinís Grannyî, she is a tough party apparatchik with a reputation as a hammer of the SNP, which ran her close in the Monklands by-election following the death of John Smith. Born 1950, educated at St Patrickís (RC) High School, Coatbridge and Strathclyde University, she ran the Scottish Labour Party for 11 years after lasting only one year as a correspondent on BBC Scotland, where they didnít like her strong Lanarkshire accent. Controversially she spent four years as Robert Maxwellís PR chief in Scotland, and wrote a bodice-ripping novel, Elite, in 1990.
 |
| Wealthy Achievers, Suburban Areas |
3.17% |
14.99% |
21.17 |
|
| Affluent Greys, Rural Communities |
0.08% |
2.13% |
3.58 |
|
| Prosperous Pensioners, Retirement Areas |
0.00% |
2.49% |
0.00 |
|
| Affluent Executives, Family Areas |
2.53% |
4.43% |
57.13 |
|
| Well-Off Workers, Family Areas |
9.20% |
7.27% |
126.52 |
|
| Affluent Urbanites, Town & City Areas |
0.54% |
2.56% |
20.88 |
|
| Prosperous Professionals, Metropolitan Areas |
0.00% |
2.04% |
0.00 |
|
| Better-Off Executives, Inner City Areas |
0.11% |
3.94% |
2.70 |
|
| Comfortable Middle Agers, Mature Home Owning Areas |
2.14% |
13.04% |
16.43 |
|
| Skilled Workers, Home Owning Areas |
6.64% |
12.70% |
52.31 |
|
| New Home Owners, Mature Communities |
8.20% |
8.14% |
100.66 |
|
| White Collar Workers, Better-Off Multi Ethnic Areas |
1.02% |
4.02% |
25.33 |
|
| Older People, Less Prosperous Areas |
3.39% |
3.19% |
106.48 |
|
| Council Estate Residents, Better-Off Homes |
36.48% |
11.31% |
322.51 |
|
| Council Estate Residents, High Unemployment |
11.13% |
3.06% |
363.45 |
|
| Council Estate Residents, Greatest Hardship |
15.08% |
2.52% |
598.62 |
|
| People in Multi-Ethnic, Low-Income Areas |
0.00% |
2.10% |
0.00 |
|
| Unclassified |
0.30% |
0.06% |
480.06 |
|
|
 |
 |
 |
| £0-5K |
11.78% |
9.41% |
125.11 |
|
| £5-10K |
19.84% |
16.63% |
119.27 |
|
| £10-15K |
18.44% |
16.58% |
111.21 |
|
| £15-20K |
14.08% |
13.58% |
103.63 |
|
| £20-25K |
10.08% |
10.39% |
97.03 |
|
| £25-30K |
7.10% |
7.77% |
91.33 |
|
| £30-35K |
5.00% |
5.79% |
86.35 |
|
| £35-40K |
3.55% |
4.33% |
81.93 |
|
| £40-45K |
2.54% |
3.27% |
77.92 |
|
| £45-50K |
1.84% |
2.48% |
74.26 |
|
| £50-55K |
1.35% |
1.90% |
70.88 |
|
| £55-60K |
1.00% |
1.47% |
67.74 |
|
| £60-65K |
0.75% |
1.15% |
64.81 |
|
| £65-70K |
0.56% |
0.91% |
62.07 |
|
| £70-75K |
0.43% |
0.72% |
59.51 |
|
| £75-80K |
0.33% |
0.57% |
57.11 |
|
| £80-85K |
0.25% |
0.46% |
54.85 |
|
| £85-90K |
0.20% |
0.37% |
52.73 |
|
| £90-95K |
0.15% |
0.31% |
50.73 |
|
| £95-100K |
0.12% |
0.25% |
48.84 |
|
| £100K + |
0.53% |
1.34% |
39.18 |
|
|
|

|


|
1992-1997
|
1997-2001
|
|
|
|
| Con |
-6.01% |
| Lab |
-0.68% |
| LD |
-0.33% |
| SNP |
6.30% |
|
| Con |
-2.71% |
| Lab |
-3.60% |
| LD |
3.31% |
| SNP |
-5.06% |
|
|
 |
Helen Liddell
Labour hold
|
| Con |
 |
1,960 |
6.18% |
| Lab |
 |
18,478 |
58.22% |
| LD |
 |
2,376 |
7.49% |
| SNP |
 |
6,138 |
19.34% |
| Oth |
 |
2,784 |
8.77% |
| Maj |
 |
12,340 |
38.88% |
| Turn |
 |
31,736 |
54.39% |
|
|
 |
Helen Liddell
Labour hold
|
| Scot U |
Mary Dempsey |
1,439 |
4.53% |
| Soc Lab |
Chris Herriot |
174 |
0.55% |
| L |
Helen Liddell |
18,478 |
58.22% |
| SNP |
Alison Lindsay |
6,138 |
19.34% |
| LD |
John Love |
2,376 |
7.49% |
| SSP |
Kenny McGuigan |
1,171 |
3.69% |
| C |
Gordon McIntosh |
1,960 |
6.18% |
|
Candidates representing 7 parties stood for election to this seat.
|
|
 |
Helen Liddell
Labour
|
| Con |
 |
3,660 |
8.89% |
| Lab |
 |
25,460 |
61.82% |
| LD |
 |
1,719 |
4.17% |
| SNP |
 |
10,048 |
24.40% |
| Ref |
 |
294 |
0.71% |
| Oth |
|
0 |
0.00% |
| Maj |
 |
15,412 |
37.43% |
| Turn |
 |
41,181 |
71.40% |
|
|
 |
|
Labour
|
| Con |
 |
6,588 |
14.90% |
| Lab |
 |
27,678 |
62.50% |
| LD |
 |
1,997 |
4.50% |
| SNP |
 |
8,023 |
18.10% |
| Oth |
|
0 |
0.00% |
| Maj |
 |
19,655 |
44.40% |
| Turn |
 |
44,286 |
74.73% |
|
|
 |
|

|

