|
Birmingham, Selly Oak
Labour hold

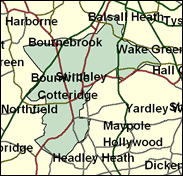
Though gained from the Tories as recently as 1992, Selly Oak now looks like a safe long-term Labour prospect; yet another example of the drift away from the Conservatives in Britain's urban areas in the last three decades. This southern Birmingham seat includes a mixture of residential areas such as the formerly very middle class Moseley, its large houses in leafy streets now largely multi-occupied, and the Cadbury model village of Bournville. The seat had been Conservative from 1955 to February 1974, during which time it survived three Labour General election wins including one landslide, then alternated between the major parties until the Nineties. Now Lynne Jones has a 14,000 majority and it seems to have passed the way of so many former Tory urban prospects.

Lynne Jones, MP here since 1992, has replaced Clare Short as Birmingham's most leftwing Labour MP. A Campaign Group member, she has been active in all the main revolts against the Blair government from lone parent benefit cuts in 1997, to air traffic control privatisation in 2000. A winsomely attractive 49 year-old former Birmingham City Councillor, she was educated at Bartley Green Girls Grammar School and Birmingham University, acquiring a doctorate in biochemistry. Her deceptively mild-looking appearance belies the tough idealism of a red-hot radical.
 |
| Wealthy Achievers, Suburban Areas |
10.82% |
14.99% |
72.19 |
|
| Affluent Greys, Rural Communities |
0.00% |
2.13% |
0.00 |
|
| Prosperous Pensioners, Retirement Areas |
1.54% |
2.49% |
62.02 |
|
| Affluent Executives, Family Areas |
0.05% |
4.43% |
1.14 |
|
| Well-Off Workers, Family Areas |
3.62% |
7.27% |
49.73 |
|
| Affluent Urbanites, Town & City Areas |
6.71% |
2.56% |
261.68 |
|
| Prosperous Professionals, Metropolitan Areas |
3.28% |
2.04% |
160.82 |
|
| Better-Off Executives, Inner City Areas |
13.40% |
3.94% |
339.86 |
|
| Comfortable Middle Agers, Mature Home Owning Areas |
9.14% |
13.04% |
70.07 |
|
| Skilled Workers, Home Owning Areas |
12.23% |
12.70% |
96.30 |
|
| New Home Owners, Mature Communities |
5.97% |
8.14% |
73.34 |
|
| White Collar Workers, Better-Off Multi Ethnic Areas |
9.08% |
4.02% |
225.76 |
|
| Older People, Less Prosperous Areas |
3.70% |
3.19% |
116.24 |
|
| Council Estate Residents, Better-Off Homes |
9.18% |
11.31% |
81.19 |
|
| Council Estate Residents, High Unemployment |
2.23% |
3.06% |
72.87 |
|
| Council Estate Residents, Greatest Hardship |
5.82% |
2.52% |
230.97 |
|
| People in Multi-Ethnic, Low-Income Areas |
3.19% |
2.10% |
151.80 |
|
| Unclassified |
0.03% |
0.06% |
43.65 |
|
|
 |
 |
 |
| £0-5K |
10.96% |
9.41% |
116.47 |
|
| £5-10K |
17.36% |
16.63% |
104.40 |
|
| £10-15K |
16.73% |
16.58% |
100.90 |
|
| £15-20K |
13.52% |
13.58% |
99.51 |
|
| £20-25K |
10.25% |
10.39% |
98.63 |
|
| £25-30K |
7.60% |
7.77% |
97.78 |
|
| £30-35K |
5.61% |
5.79% |
96.84 |
|
| £35-40K |
4.15% |
4.33% |
95.80 |
|
| £40-45K |
3.09% |
3.27% |
94.69 |
|
| £45-50K |
2.32% |
2.48% |
93.55 |
|
| £50-55K |
1.76% |
1.90% |
92.41 |
|
| £55-60K |
1.35% |
1.47% |
91.28 |
|
| £60-65K |
1.04% |
1.15% |
90.19 |
|
| £65-70K |
0.81% |
0.91% |
89.14 |
|
| £70-75K |
0.63% |
0.72% |
88.14 |
|
| £75-80K |
0.50% |
0.57% |
87.19 |
|
| £80-85K |
0.40% |
0.46% |
86.30 |
|
| £85-90K |
0.32% |
0.37% |
85.46 |
|
| £90-95K |
0.26% |
0.31% |
84.67 |
|
| £95-100K |
0.21% |
0.25% |
83.93 |
|
| £100K + |
1.08% |
1.34% |
80.32 |
|
|
|

|


|
1992-1997
|
1997-2001
|
|
|
|
| Con |
-14.54% |
| Lab |
9.63% |
| LD |
1.81% |
|
| Con |
-1.14% |
| Lab |
-3.22% |
| LD |
4.18% |
|
|
 |
Lynne Jones
Labour hold
|
| Con |
 |
10,676 |
26.62% |
| Lab |
 |
21,015 |
52.41% |
| LD |
 |
6,532 |
16.29% |
| Oth |
 |
1,877 |
4.68% |
| Maj |
 |
10,339 |
25.78% |
| Turn |
 |
40,100 |
56.29% |
|
|
 |
Lynne Jones
Labour hold
|
| C |
Ken Hardeman |
10,676 |
26.62% |
| L |
Lynne Jones |
21,015 |
52.41% |
| LD |
David Osbourne |
6,532 |
16.29% |
| G |
Barney Smith |
1,309 |
3.26% |
| UK |
Beryl Williams |
568 |
1.42% |
|
Candidates representing 5 parties stood for election to this seat.
|
|
 |
Lynne Jones
Labour
|
| Con |
 |
14,033 |
27.76% |
| Lab |
 |
28,121 |
55.63% |
| LD |
 |
6,121 |
12.11% |
| Ref |
 |
1,520 |
3.01% |
| Oth |
 |
755 |
1.49% |
| Maj |
 |
14,088 |
27.87% |
| Turn |
 |
50,550 |
70.16% |
|
|
 |
|
Labour
|
| Con |
 |
23,370 |
42.30% |
| Lab |
 |
25,430 |
46.00% |
| LD |
 |
5,679 |
10.30% |
| Oth |
 |
797 |
1.40% |
| Maj |
 |
2,060 |
3.70% |
| Turn |
 |
55,276 |
75.82% |
|
|
 |
|

|

