|
Vauxhall
Labour hold

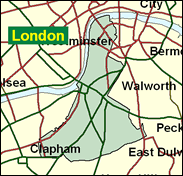
There are some distinguished names in a seat so close to the heart of London, just across the river from Westminster itself: the former London County Hall, Lambeth Palace, the South Bank arts complex, the Oval Test and Surrey cricket ground and the Waterloo stations, terminal for the Channel tunnel passenger service Eurostar. However this is in the main poor inner city terrain, at the north end of the borough of Lambeth. Lambeth has had its troubles in the past, especially within a Labour party variously accused of extremist left wing policies, and incompetence. The Liberal Democrats have picked them up on this, and held several wards in the far north of the seat in the May 1998 borough elections, finishing only 10pc behind Labour within Vauxhall constituency. In the General Election their candidate Keith Kerr moved into second place, but Kate Hoey is very safe here in national contests, and Labour wins at all levels as the seat moves south into parts of Clapham and Brixton.

Kate Hoey is one of Labour's tousled-haired, shoulder-padded, feminising shock troops of the 1980s. Elected here in 1989, she now combines her career as Sports Minister with politically incorrect views in favour of fox-hunting, gun ownership and football terracing. She is unsympathetic to "women's ministries or female issues", and is a non-republican in Irish politics - a fairly off-message attitudinal set. Bearing the stamp of her Ulster background with a metallic nasal brogue, she was born in 1946 into a farming family, attended Belfast Royal Academy, Ulster College of Physical Education and City of London College. She worked as a further education lecturer and eventually as 'educational adviser' to Arsenal, Spurs and Chelsea football clubs. Like many Blair ministers she has an airbrushed left-wing past, in her case as a member of the Trotskyist International Marxist Group, in which incarnation she gave NUS President Jack Straw some trouble back in the later 1960s. Her partner Tom Stoddart helped coax Martin Bell to stand as a Labour-backed 'Independent' in Tatton in 1997.
 |
| Wealthy Achievers, Suburban Areas |
0.00% |
14.99% |
0.00 |
|
| Affluent Greys, Rural Communities |
0.06% |
2.13% |
2.60 |
|
| Prosperous Pensioners, Retirement Areas |
0.24% |
2.49% |
9.79 |
|
| Affluent Executives, Family Areas |
0.00% |
4.43% |
0.00 |
|
| Well-Off Workers, Family Areas |
0.19% |
7.27% |
2.67 |
|
| Affluent Urbanites, Town & City Areas |
1.84% |
2.56% |
71.73 |
|
| Prosperous Professionals, Metropolitan Areas |
11.57% |
2.04% |
566.91 |
|
| Better-Off Executives, Inner City Areas |
24.29% |
3.94% |
615.90 |
|
| Comfortable Middle Agers, Mature Home Owning Areas |
0.00% |
13.04% |
0.00 |
|
| Skilled Workers, Home Owning Areas |
0.00% |
12.70% |
0.00 |
|
| New Home Owners, Mature Communities |
0.00% |
8.14% |
0.00 |
|
| White Collar Workers, Better-Off Multi Ethnic Areas |
3.37% |
4.02% |
83.81 |
|
| Older People, Less Prosperous Areas |
0.00% |
3.19% |
0.00 |
|
| Council Estate Residents, Better-Off Homes |
0.00% |
11.31% |
0.00 |
|
| Council Estate Residents, High Unemployment |
12.89% |
3.06% |
420.83 |
|
| Council Estate Residents, Greatest Hardship |
0.00% |
2.52% |
0.00 |
|
| People in Multi-Ethnic, Low-Income Areas |
45.31% |
2.10% |
2,157.64 |
|
| Unclassified |
0.24% |
0.06% |
384.90 |
|
|
 |
 |
 |
| £0-5K |
9.17% |
9.41% |
97.39 |
|
| £5-10K |
14.19% |
16.63% |
85.29 |
|
| £10-15K |
14.30% |
16.58% |
86.24 |
|
| £15-20K |
12.30% |
13.58% |
90.54 |
|
| £20-25K |
9.97% |
10.39% |
95.93 |
|
| £25-30K |
7.90% |
7.77% |
101.57 |
|
| £30-35K |
6.21% |
5.79% |
107.15 |
|
| £35-40K |
4.87% |
4.33% |
112.51 |
|
| £40-45K |
3.84% |
3.27% |
117.61 |
|
| £45-50K |
3.04% |
2.48% |
122.43 |
|
| £50-55K |
2.42% |
1.90% |
126.98 |
|
| £55-60K |
1.94% |
1.47% |
131.29 |
|
| £60-65K |
1.56% |
1.15% |
135.35 |
|
| £65-70K |
1.26% |
0.91% |
139.21 |
|
| £70-75K |
1.03% |
0.72% |
142.86 |
|
| £75-80K |
0.84% |
0.57% |
146.34 |
|
| £80-85K |
0.69% |
0.46% |
149.66 |
|
| £85-90K |
0.57% |
0.37% |
152.82 |
|
| £90-95K |
0.48% |
0.31% |
155.85 |
|
| £95-100K |
0.40% |
0.25% |
158.74 |
|
| £100K + |
2.36% |
1.34% |
175.37 |
|
|
|

|


|
1992-1997
|
1997-2001
|
|
|
|
| Con |
-11.39% |
| Lab |
7.69% |
| LD |
1.62% |
|
| Con |
-1.14% |
| Lab |
-1.93% |
| LD |
5.04% |
|
|
 |
Kate Hoey
Labour hold
|
| Con |
 |
4,489 |
14.07% |
| Lab |
 |
19,738 |
61.86% |
| LD |
 |
6,720 |
21.06% |
| Oth |
 |
960 |
3.01% |
| Maj |
 |
13,018 |
40.80% |
| Turn |
 |
31,907 |
42.84% |
|
|
 |
Kate Hoey
Labour hold
|
| SA |
Theresa Bennett |
853 |
2.67% |
| C |
Anthony Bottrall |
4,489 |
14.07% |
| I |
Martin Boyd |
107 |
0.34% |
| LD |
Shane Collins |
6,720 |
21.06% |
| L |
Kate Hoey |
19,738 |
61.86% |
|
Candidates representing 5 parties stood for election to this seat.
|
|
 |
Kate Hoey
Labour
|
| Con |
 |
5,942 |
15.21% |
| Lab |
 |
24,920 |
63.79% |
| LD |
 |
6,260 |
16.02% |
| Ref |
|
0 |
0.00% |
| Oth |
 |
1,944 |
4.98% |
| Maj |
 |
18,660 |
47.77% |
| Turn |
 |
39,066 |
55.49% |
|
|
 |
|
Labour
|
| Con |
 |
11,517 |
26.60% |
| Lab |
 |
24,278 |
56.10% |
| LD |
 |
6,247 |
14.40% |
| Oth |
 |
1,236 |
2.90% |
| Maj |
 |
12,761 |
29.50% |
| Turn |
 |
43,278 |
63.68% |
|
|
 |
|

|

