|
Wakefield
Labour hold

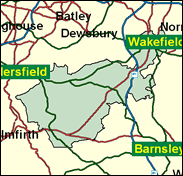
This cathedral city in West Yorkshire, the centre of its own Metropolitan Borough, has been Labour since 1932, when Arthur Greenwood, who had been Minister of Health in Ramsay MacDonald's second government (1929-31) returned to Parliament in a by-election following defeat in Labour's greatest ever disaster of 1931. In 1983 the majority was reduced to three figures in another Conservative landslide, and there are Tory votes here. In May 2000, for example, the Conservatives not only won the two Kirklees borough wards included in this seat, Kirkburton and Denby Dale, but also, horror of horrors, Wakefield Central itself (by 4 votes), and, less surprisingly, Wakefield Rural. It is fortunate for Labour that the best residential area, Wakefield South, is not actually in the seat any more, for that really would have given the Conservatives an unlikely but statistically supportable hope of making this seat marginal again, but its heavy Tory vote is overwhelmed now by the Hemsworth Labour juggernaut. The best that the Conservatives can realistically hope for in Wakefield is to reduce David Hinchcliffe's 14,600 majority.

David Hinchliffe, dogged and earnest former social worker and present Health Select Committee chairman, first elected here in 1987, is a local man off Wakefield Council. He was born in 1948, educated at Cathedral Secondary Modern School, Wakefield, Wakefield Technical College, Leeds Polytechnic and Bradford University. Bearded and no Blairite, he voted for Prescott in 1994 and quit the front bench in 1995 after shadowing social services and community care for three years, partly because of his opposition to New Labour "modernising".
 |
| Wealthy Achievers, Suburban Areas |
14.73% |
14.99% |
98.26 |
|
| Affluent Greys, Rural Communities |
0.03% |
2.13% |
1.20 |
|
| Prosperous Pensioners, Retirement Areas |
0.34% |
2.49% |
13.85 |
|
| Affluent Executives, Family Areas |
4.27% |
4.43% |
96.58 |
|
| Well-Off Workers, Family Areas |
13.79% |
7.27% |
189.65 |
|
| Affluent Urbanites, Town & City Areas |
0.57% |
2.56% |
22.41 |
|
| Prosperous Professionals, Metropolitan Areas |
0.00% |
2.04% |
0.00 |
|
| Better-Off Executives, Inner City Areas |
1.11% |
3.94% |
28.19 |
|
| Comfortable Middle Agers, Mature Home Owning Areas |
15.24% |
13.04% |
116.86 |
|
| Skilled Workers, Home Owning Areas |
11.89% |
12.70% |
93.61 |
|
| New Home Owners, Mature Communities |
6.66% |
8.14% |
81.74 |
|
| White Collar Workers, Better-Off Multi Ethnic Areas |
2.58% |
4.02% |
64.25 |
|
| Older People, Less Prosperous Areas |
4.30% |
3.19% |
134.93 |
|
| Council Estate Residents, Better-Off Homes |
16.62% |
11.31% |
146.90 |
|
| Council Estate Residents, High Unemployment |
4.15% |
3.06% |
135.55 |
|
| Council Estate Residents, Greatest Hardship |
2.80% |
2.52% |
111.10 |
|
| People in Multi-Ethnic, Low-Income Areas |
0.46% |
2.10% |
22.00 |
|
| Unclassified |
0.45% |
0.06% |
719.88 |
|
|
 |
 |
 |
| £0-5K |
8.98% |
9.41% |
95.38 |
|
| £5-10K |
16.35% |
16.63% |
98.29 |
|
| £10-15K |
16.59% |
16.58% |
100.06 |
|
| £15-20K |
13.79% |
13.58% |
101.54 |
|
| £20-25K |
10.66% |
10.39% |
102.60 |
|
| £25-30K |
8.02% |
7.77% |
103.21 |
|
| £30-35K |
5.99% |
5.79% |
103.42 |
|
| £35-40K |
4.48% |
4.33% |
103.29 |
|
| £40-45K |
3.36% |
3.27% |
102.89 |
|
| £45-50K |
2.54% |
2.48% |
102.27 |
|
| £50-55K |
1.93% |
1.90% |
101.49 |
|
| £55-60K |
1.48% |
1.47% |
100.57 |
|
| £60-65K |
1.15% |
1.15% |
99.56 |
|
| £65-70K |
0.89% |
0.91% |
98.48 |
|
| £70-75K |
0.70% |
0.72% |
97.35 |
|
| £75-80K |
0.55% |
0.57% |
96.18 |
|
| £80-85K |
0.44% |
0.46% |
94.99 |
|
| £85-90K |
0.35% |
0.37% |
93.79 |
|
| £90-95K |
0.28% |
0.31% |
92.58 |
|
| £95-100K |
0.23% |
0.25% |
91.36 |
|
| £100K + |
1.12% |
1.34% |
83.27 |
|
|
|

|


|
1992-1997
|
1997-2001
|
|
|
|
| Con |
-12.03% |
| Lab |
9.20% |
| LD |
-0.10% |
|
| Con |
2.17% |
| Lab |
-7.48% |
| LD |
1.15% |
|
|
 |
David Hinchliffe
Labour hold
|
| Con |
 |
12,638 |
30.63% |
| Lab |
 |
20,592 |
49.92% |
| LD |
 |
5,097 |
12.36% |
| Oth |
 |
2,927 |
7.10% |
| Maj |
 |
7,954 |
19.28% |
| Turn |
 |
41,254 |
54.46% |
|
|
 |
David Hinchliffe
Labour hold
|
| SL |
Abdul Aziz |
634 |
1.54% |
| UK |
Janice Cannon |
677 |
1.64% |
| LD |
Douglas Dale |
5,097 |
12.36% |
| G |
Sarah Greenwood |
1,075 |
2.61% |
| SA |
Mick Griffiths |
541 |
1.31% |
| L |
David Hinchliffe |
20,592 |
49.92% |
| C |
Thelma Karran |
12,638 |
30.63% |
|
Candidates representing 7 parties stood for election to this seat.
|
|
 |
David Hinchliffe
Labour
|
| Con |
 |
14,373 |
28.47% |
| Lab |
 |
28,977 |
57.40% |
| LD |
 |
5,656 |
11.20% |
| Ref |
 |
1,480 |
2.93% |
| Oth |
|
0 |
0.00% |
| Maj |
 |
14,604 |
28.93% |
| Turn |
 |
50,486 |
68.96% |
|
|
 |
|
Labour
|
| Con |
 |
21,983 |
40.50% |
| Lab |
 |
26,207 |
48.20% |
| LD |
 |
6,128 |
11.30% |
| Oth |
|
0 |
0.00% |
| Maj |
 |
4,224 |
7.80% |
| Turn |
 |
54,318 |
75.49% |
|
|
 |
|

|

