|
Walsall North
Labour hold

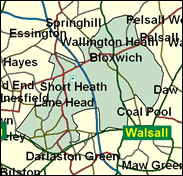
Walsall North is a very working class seat. According to the last Census, in 1991 it had the seventh lowest proportion of non-manual (white collar) workers in Britain. It has the second highest percentage of council tenants of any constituency in the West Midlands. Yet it has often only elected David Winnick for Labour with relatively small majorities, although this was disguised in 1997 by a near-average national swing. Why this apparent contradiction? This seat is on the edge of the west Midlands conurbation. Rather than inner city neighbourhoods, it is typified by self contained communities of skilled manual workers such as Willenhall and Bloxwich. It is 94pc white, well above the average in this cosmopolitan conurbation. Its industries are small and medium rather than heavy, and usually private sector. This is a hard, materialist part of the world with little room for left wing or liberal sentiment.

David Winnick, one of Labour's lone awkward squaddies, was first elected here in 1979, but much earlier (1966-70) sat for Croydon South. He was born in 1933, educated somewhat erratically during the War, and worked variously as a clerk, an advertising manager for Tribune, and in the UK Immigration Advisory Service. Admitting that he is "unclubbable", and dubbed by John Major as having "about as much charm as a puff adder", he was the 23rd most rebellious Labour MP between 1992 and 1997, and vocal in opposition to Blair's dropping of Clause Four. He has opposed the Blair government on lone parent benefit cuts, predatory pricing of the Murdoch press, disability benefit cuts, air traffic control privatisation, and freedom of information. Though an opponent of standard left-wing supporters of Milosevic and Saddam Hussein, he is also a Jew who supports the creation of a Palestinian state.
 |
| Wealthy Achievers, Suburban Areas |
1.87% |
14.99% |
12.49 |
|
| Affluent Greys, Rural Communities |
0.00% |
2.13% |
0.00 |
|
| Prosperous Pensioners, Retirement Areas |
0.46% |
2.49% |
18.50 |
|
| Affluent Executives, Family Areas |
4.61% |
4.43% |
104.22 |
|
| Well-Off Workers, Family Areas |
11.46% |
7.27% |
157.59 |
|
| Affluent Urbanites, Town & City Areas |
0.00% |
2.56% |
0.00 |
|
| Prosperous Professionals, Metropolitan Areas |
0.00% |
2.04% |
0.00 |
|
| Better-Off Executives, Inner City Areas |
0.00% |
3.94% |
0.00 |
|
| Comfortable Middle Agers, Mature Home Owning Areas |
0.98% |
13.04% |
7.52 |
|
| Skilled Workers, Home Owning Areas |
13.48% |
12.70% |
106.08 |
|
| New Home Owners, Mature Communities |
14.89% |
8.14% |
182.89 |
|
| White Collar Workers, Better-Off Multi Ethnic Areas |
0.00% |
4.02% |
0.00 |
|
| Older People, Less Prosperous Areas |
4.88% |
3.19% |
153.33 |
|
| Council Estate Residents, Better-Off Homes |
35.48% |
11.31% |
313.66 |
|
| Council Estate Residents, High Unemployment |
3.11% |
3.06% |
101.64 |
|
| Council Estate Residents, Greatest Hardship |
8.40% |
2.52% |
333.36 |
|
| People in Multi-Ethnic, Low-Income Areas |
0.37% |
2.10% |
17.75 |
|
| Unclassified |
0.00% |
0.06% |
0.00 |
|
|
 |
 |
 |
| £0-5K |
15.12% |
9.41% |
160.59 |
|
| £5-10K |
22.36% |
16.63% |
134.43 |
|
| £10-15K |
19.20% |
16.58% |
115.81 |
|
| £15-20K |
13.84% |
13.58% |
101.88 |
|
| £20-25K |
9.40% |
10.39% |
90.49 |
|
| £25-30K |
6.28% |
7.77% |
80.75 |
|
| £30-35K |
4.19% |
5.79% |
72.32 |
|
| £35-40K |
2.82% |
4.33% |
65.04 |
|
| £40-45K |
1.92% |
3.27% |
58.76 |
|
| £45-50K |
1.32% |
2.48% |
53.33 |
|
| £50-55K |
0.93% |
1.90% |
48.63 |
|
| £55-60K |
0.66% |
1.47% |
44.55 |
|
| £60-65K |
0.47% |
1.15% |
40.97 |
|
| £65-70K |
0.34% |
0.91% |
37.83 |
|
| £70-75K |
0.25% |
0.72% |
35.05 |
|
| £75-80K |
0.19% |
0.57% |
32.57 |
|
| £80-85K |
0.14% |
0.46% |
30.36 |
|
| £85-90K |
0.11% |
0.37% |
28.38 |
|
| £90-95K |
0.08% |
0.31% |
26.59 |
|
| £95-100K |
0.06% |
0.25% |
24.97 |
|
| £100K + |
0.24% |
1.34% |
17.97 |
|
|
|

|


|
1992-1997
|
1997-2001
|
|
|
|
| Con |
-11.85% |
| Lab |
9.92% |
| LD |
-3.35% |
|
| Con |
1.51% |
| Lab |
1.50% |
| LD |
-0.31% |
|
|
 |
David Winnick
Labour hold
|
| Con |
 |
9,388 |
29.05% |
| Lab |
 |
18,779 |
58.12% |
| LD |
 |
2,923 |
9.05% |
| Oth |
 |
1,222 |
3.78% |
| Maj |
 |
9,391 |
29.06% |
| Turn |
 |
32,312 |
48.94% |
|
|
 |
David Winnick
Labour hold
|
| SA |
Dave Church |
410 |
1.27% |
| LD |
Michael Heap |
2,923 |
9.05% |
| UK |
Jenny Mayo |
812 |
2.51% |
| C |
Melvin Pitt |
9,388 |
29.05% |
| L |
David Winnick |
18,779 |
58.12% |
|
Candidates representing 5 parties stood for election to this seat.
|
|
 |
David Winnick
Labour
|
| Con |
 |
11,929 |
27.55% |
| Lab |
 |
24,517 |
56.62% |
| LD |
 |
4,050 |
9.35% |
| Ref |
 |
1,430 |
3.30% |
| Oth |
 |
1,376 |
3.18% |
| Maj |
 |
12,588 |
29.07% |
| Turn |
 |
43,302 |
64.07% |
|
|
 |
|
Labour
|
| Con |
 |
20,563 |
39.40% |
| Lab |
 |
24,387 |
46.70% |
| LD |
 |
6,629 |
12.70% |
| Oth |
 |
614 |
1.20% |
| Maj |
 |
3,824 |
7.30% |
| Turn |
 |
52,193 |
74.67% |
|
|
 |
|

|

