|
Walthamstow
Labour hold

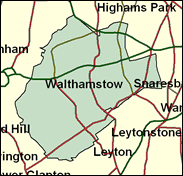
Walthamstow has had a colourful political history. Including Clement Attlee's seat at the end of his parliamentary career, and the site of not one but two spectacular Labour by-election defeats during Harold Wilson's 1966-70 term of office, it was also lost as a unified seat in 1987. Yet this is a working class seat in the east end, not that far out towards the edge of London, with a 30pc non-white population, above even the capital's average, with little signs of fashionability or gentrification. The situation seems to be that Walthamstow is in fact true to Labour for most of the time, except in aberrant circumstances like by-elections or very unpopular periods in the party's past, and that new Labour looks organised enough to avoid these pitfalls. After all, Neil Gerrard won by 17,000 after an 18pc swing in 1997, one of the largest in the country. There is no sign that this will be reversed.

Neil Gerrard was elected in 1992, fresh from being leader of Waltham Forest Council, where huge rate rises had delivered the Walthamstow seat to the Conservatives against the trend in 1987. Though he defied the Labour whip 26 times during the 1992 Parliament and resigned as Dawn Primarolo's PPS in order to abstain over lone parent benefit cuts, his record of revolt against the Blair government is, for a Campaign Grouper, relatively slight. His hostile voting has been confined to the threatened use of force against Iraq, pensions linked to earnings, incapacity benefit cuts and jury trial curbs. Of gnarled, coarse-featured visage, he was born 1942, educated at Manchester Grammar School and Wadham College, Oxford, and previously worked as a schoolteacher, then FE lecturer in computing.
 |
| Wealthy Achievers, Suburban Areas |
0.00% |
14.99% |
0.00 |
|
| Affluent Greys, Rural Communities |
0.00% |
2.13% |
0.00 |
|
| Prosperous Pensioners, Retirement Areas |
0.35% |
2.49% |
14.04 |
|
| Affluent Executives, Family Areas |
0.06% |
4.43% |
1.31 |
|
| Well-Off Workers, Family Areas |
0.00% |
7.27% |
0.00 |
|
| Affluent Urbanites, Town & City Areas |
6.63% |
2.56% |
258.44 |
|
| Prosperous Professionals, Metropolitan Areas |
4.08% |
2.04% |
200.10 |
|
| Better-Off Executives, Inner City Areas |
6.80% |
3.94% |
172.35 |
|
| Comfortable Middle Agers, Mature Home Owning Areas |
1.68% |
13.04% |
12.88 |
|
| Skilled Workers, Home Owning Areas |
6.91% |
12.70% |
54.39 |
|
| New Home Owners, Mature Communities |
0.30% |
8.14% |
3.65 |
|
| White Collar Workers, Better-Off Multi Ethnic Areas |
50.27% |
4.02% |
1,250.02 |
|
| Older People, Less Prosperous Areas |
0.34% |
3.19% |
10.64 |
|
| Council Estate Residents, Better-Off Homes |
5.66% |
11.31% |
50.02 |
|
| Council Estate Residents, High Unemployment |
9.97% |
3.06% |
325.68 |
|
| Council Estate Residents, Greatest Hardship |
0.83% |
2.52% |
32.78 |
|
| People in Multi-Ethnic, Low-Income Areas |
6.13% |
2.10% |
291.97 |
|
| Unclassified |
0.00% |
0.06% |
0.00 |
|
|
 |
 |
 |
| £0-5K |
7.11% |
9.41% |
75.52 |
|
| £5-10K |
13.48% |
16.63% |
81.03 |
|
| £10-15K |
15.00% |
16.58% |
90.50 |
|
| £15-20K |
13.51% |
13.58% |
99.48 |
|
| £20-25K |
11.12% |
10.39% |
106.99 |
|
| £25-30K |
8.78% |
7.77% |
112.91 |
|
| £30-35K |
6.80% |
5.79% |
117.40 |
|
| £35-40K |
5.23% |
4.33% |
120.70 |
|
| £40-45K |
4.02% |
3.27% |
123.02 |
|
| £45-50K |
3.09% |
2.48% |
124.58 |
|
| £50-55K |
2.39% |
1.90% |
125.54 |
|
| £55-60K |
1.86% |
1.47% |
126.04 |
|
| £60-65K |
1.45% |
1.15% |
126.17 |
|
| £65-70K |
1.14% |
0.91% |
126.03 |
|
| £70-75K |
0.90% |
0.72% |
125.68 |
|
| £75-80K |
0.72% |
0.57% |
125.18 |
|
| £80-85K |
0.58% |
0.46% |
124.55 |
|
| £85-90K |
0.46% |
0.37% |
123.84 |
|
| £90-95K |
0.38% |
0.31% |
123.07 |
|
| £95-100K |
0.31% |
0.25% |
122.26 |
|
| £100K + |
1.56% |
1.34% |
116.26 |
|
|
|

|


|
1992-1997
|
1997-2001
|
|
|
|
| Con |
-16.88% |
| Lab |
18.83% |
| LD |
-2.09% |
|
| Con |
-2.25% |
| Lab |
-0.97% |
| LD |
0.88% |
|
|
 |
Neil Gerrard
Labour hold
|
| Con |
 |
6,221 |
18.07% |
| Lab |
 |
21,402 |
62.16% |
| LD |
 |
5,024 |
14.59% |
| Oth |
 |
1,782 |
5.18% |
| Maj |
 |
15,181 |
44.09% |
| Turn |
 |
34,429 |
53.46% |
|
|
 |
Neil Gerrard
Labour hold
|
| C |
Nick Boys Smith |
6,221 |
18.07% |
| S Alt |
Simon Donovan |
806 |
2.34% |
| P |
Barbara Duffy |
289 |
0.84% |
| LD |
Peter Dunphy |
5,024 |
14.59% |
| L |
Neil Gerrard |
21,402 |
62.16% |
| UK |
Gerda Mayer |
298 |
0.87% |
| BNP |
William Phillips |
389 |
1.13% |
|
Candidates representing 7 parties stood for election to this seat.
|
|
 |
Neil Gerrard
Labour
|
| Con |
 |
8,138 |
20.32% |
| Lab |
 |
25,287 |
63.13% |
| LD |
 |
5,491 |
13.71% |
| Ref |
 |
1,139 |
2.84% |
| Oth |
|
0 |
0.00% |
| Maj |
 |
17,149 |
42.81% |
| Turn |
 |
40,055 |
62.76% |
|
|
 |
|
Labour
|
| Con |
 |
17,650 |
37.20% |
| Lab |
 |
21,001 |
44.30% |
| LD |
 |
7,489 |
15.80% |
| Oth |
 |
1,285 |
2.70% |
| Maj |
 |
3,351 |
7.10% |
| Turn |
 |
47,425 |
71.41% |
|
|
 |
|

|

