|
Wansdyke
Labour hold

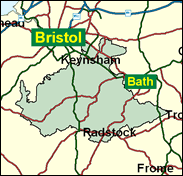
Wansdyke has achieved some notability as "the sort of seat that the Tories should never have lost in the first place" (Telegraph commentator Sîon Simon, December 2000). Indeed it was a surprise when Dan Norris took the south western region constituency of Wansdyke for Labour with a swing of over 14 pc in 1997, but it is not as if it has no Labour tradition at all. Besides the mixed town of Keynsham, the site of a bridge cut on more than one occasion during the last major land war campaign in England in the late 1680s, has long been closely contested, as have the Kingswood Borough sections of the seat centring on Bitton and Hanham Abbotts. What is more, the old Somerset coalfield around Paulton, Radstock and Midsomer Norton have a strong history of voting Labour. It would not break too many precedents for Labour to hold on in Wansdyke again next time. The Guardian's political editor Michael White visited the seat at the end of the year 2000, and predicted a Labour hold. He did not draw the conclusion from this, at least in print, which would be that on a uniform swing Labour would therefore be re-elected to a second term in government with an overall majority of at least 70.

Dan Morris was elected in 1997 in his second attempt to win the seat. An orthodox loyalist, he was born in 1960 and educated at Chipping Sodbury Comprehensive and Sussex University. As a former social worker specialising in child abuse, he was well-placed to ride the populist wave when paedophilia hit the headlines, and to make a show of interest in another matter of New-Labour-modish-concern, by riding (investigatively) with the local hunt in the run-up to a fox-hunting vote. With no Labour candidate having won two successive elections here on the old Somerset coalfield, Conservative Chris Watt will hope history repeats itself. A computer company manager, who was born "into farming" in 1968 and educated at Prince Henry's School, Evesham, Frome College, and Cranfield University. He held a commission for four years in the King's Regiment, and is interested in the "European democratic deficit" and transport deregulation.
 |
| Wealthy Achievers, Suburban Areas |
27.28% |
14.99% |
181.93 |
|
| Affluent Greys, Rural Communities |
0.08% |
2.13% |
3.62 |
|
| Prosperous Pensioners, Retirement Areas |
0.86% |
2.49% |
34.60 |
|
| Affluent Executives, Family Areas |
8.77% |
4.43% |
198.08 |
|
| Well-Off Workers, Family Areas |
18.58% |
7.27% |
255.49 |
|
| Affluent Urbanites, Town & City Areas |
0.35% |
2.56% |
13.55 |
|
| Prosperous Professionals, Metropolitan Areas |
0.00% |
2.04% |
0.00 |
|
| Better-Off Executives, Inner City Areas |
0.00% |
3.94% |
0.00 |
|
| Comfortable Middle Agers, Mature Home Owning Areas |
17.93% |
13.04% |
137.48 |
|
| Skilled Workers, Home Owning Areas |
12.84% |
12.70% |
101.07 |
|
| New Home Owners, Mature Communities |
7.73% |
8.14% |
94.99 |
|
| White Collar Workers, Better-Off Multi Ethnic Areas |
0.00% |
4.02% |
0.00 |
|
| Older People, Less Prosperous Areas |
2.06% |
3.19% |
64.61 |
|
| Council Estate Residents, Better-Off Homes |
3.15% |
11.31% |
27.89 |
|
| Council Estate Residents, High Unemployment |
0.37% |
3.06% |
12.07 |
|
| Council Estate Residents, Greatest Hardship |
0.00% |
2.52% |
0.00 |
|
| People in Multi-Ethnic, Low-Income Areas |
0.00% |
2.10% |
0.00 |
|
| Unclassified |
0.01% |
0.06% |
10.59 |
|
|
 |
 |
 |
| £0-5K |
6.39% |
9.41% |
67.90 |
|
| £5-10K |
14.27% |
16.63% |
85.79 |
|
| £10-15K |
16.47% |
16.58% |
99.35 |
|
| £15-20K |
14.70% |
13.58% |
108.20 |
|
| £20-25K |
11.75% |
10.39% |
113.03 |
|
| £25-30K |
8.93% |
7.77% |
114.92 |
|
| £30-35K |
6.65% |
5.79% |
114.87 |
|
| £35-40K |
4.92% |
4.33% |
113.62 |
|
| £40-45K |
3.65% |
3.27% |
111.68 |
|
| £45-50K |
2.72% |
2.48% |
109.38 |
|
| £50-55K |
2.04% |
1.90% |
106.94 |
|
| £55-60K |
1.54% |
1.47% |
104.48 |
|
| £60-65K |
1.18% |
1.15% |
102.07 |
|
| £65-70K |
0.90% |
0.91% |
99.75 |
|
| £70-75K |
0.70% |
0.72% |
97.55 |
|
| £75-80K |
0.55% |
0.57% |
95.47 |
|
| £80-85K |
0.43% |
0.46% |
93.51 |
|
| £85-90K |
0.34% |
0.37% |
91.68 |
|
| £90-95K |
0.27% |
0.31% |
89.95 |
|
| £95-100K |
0.22% |
0.25% |
88.33 |
|
| £100K + |
1.08% |
1.34% |
80.00 |
|
|
|

|


|
1992-1997
|
1997-2001
|
|
|
|
| Con |
-11.90% |
| Lab |
16.77% |
| LD |
-6.78% |
|
| Con |
0.57% |
| Lab |
2.22% |
| LD |
-2.27% |
|
|
 |
Dan Norris
Labour hold
|
| Con |
 |
17,593 |
35.87% |
| Lab |
 |
22,706 |
46.29% |
| LD |
 |
7,135 |
14.55% |
| Oth |
 |
1,613 |
3.29% |
| Maj |
 |
5,113 |
10.42% |
| Turn |
 |
49,047 |
69.35% |
|
|
 |
Dan Norris
Labour hold
|
| LD |
Gail Coleshill |
7,135 |
14.55% |
| G |
Francis Hayden |
655 |
1.34% |
| L |
Dan Norris |
22,706 |
46.29% |
| UK |
Peter Sandell |
958 |
1.95% |
| C |
Chris Watt |
17,593 |
35.87% |
|
Candidates representing 5 parties stood for election to this seat.
|
|
 |
Dan Norris
Labour gain
|
| Con |
 |
19,318 |
35.30% |
| Lab |
 |
24,117 |
44.07% |
| LD |
 |
9,205 |
16.82% |
| Ref |
 |
1,327 |
2.42% |
| Oth |
 |
755 |
1.38% |
| Maj |
 |
4,799 |
8.77% |
| Turn |
 |
54,722 |
79.27% |
|
|
 |
|
Conservative
|
| Con |
 |
27,852 |
47.20% |
| Lab |
 |
16,082 |
27.30% |
| LD |
 |
13,921 |
23.60% |
| Oth |
 |
1,150 |
1.90% |
| Maj |
 |
11,770 |
19.90% |
| Turn |
 |
59,005 |
85.84% |
|
|
 |
|

|

