|
Wantage
Conservative hold

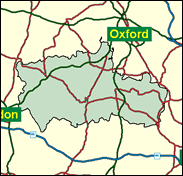
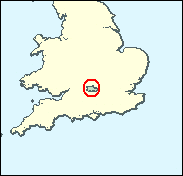
Now south west Oxfordshire, this was north west Berkshire before a sizeable chunk of the Royal County was moved, with relatively little fuss, in the local government reforms after the Redcliffe Maud Commission of the early 1970s. It has been Conservative throughout living memory, but not overwhelmingly so. Robert Jackson was re-elected for a fourth term in 1997 with under 40pc of the total vote, but retained a 6,000 majority because both Labour and the Liberal Democrats obtained a lot of votes, around 15,000 in both cases; this is a slightly larger seat than average with a significantly higher turnout rate. Labour's greatest zone of strength is Didcot, known for its power station and the only place outside Oxford to return a Labour county councillor in the depths of Labour's last unpopular government in 1977, but now diversifying and expanding as a railway junction within striking range of London Paddington. The Liberal Democrats win locally in the Vale of White Horse in a number of wards, such as Appleton, Drayton, Grove (which elects councillor Sue Marchant, known by some as the sage of the Vale), and Hendred (appropriately, for it is the home of Liberal Democrat elder statesman Lord Jenkins) and Wallingford on the Thames in South Oxfordshire district. Overall, though, the Conservatives will pick up enough votes across the seat, which also includes the Atomic Energy Research Establishment in Harwell and Shrivenham, to win again next time.

Robert Jackson was elected in 1983 after serving a term as MEP for the area including the Wantage constituency. Son of a copper miner, born 1946 in Bulawayo, and educated at Falcon College, Rhodesia, and St. Edmund Hall, Oxford, he worked variously as an Oxford don (All Souls) and political adviser, for example to Lord Soames, both as an EEC Commissioner and as last Governor of Rhodesia. A tall, bespectacled figure of donnish mien, his brief ministerial career (1989-93) involved him angering the universities by calling for the abolition of student grants and effectively the privatisation of higher education. Even if these are ideas whose time has come or is coming, his eclipse as a Clarke-voting Europhile is pretty well complete.
 |
| Wealthy Achievers, Suburban Areas |
35.36% |
14.99% |
235.85 |
|
| Affluent Greys, Rural Communities |
0.61% |
2.13% |
28.82 |
|
| Prosperous Pensioners, Retirement Areas |
1.16% |
2.49% |
46.47 |
|
| Affluent Executives, Family Areas |
9.17% |
4.43% |
207.18 |
|
| Well-Off Workers, Family Areas |
12.59% |
7.27% |
173.05 |
|
| Affluent Urbanites, Town & City Areas |
1.75% |
2.56% |
68.13 |
|
| Prosperous Professionals, Metropolitan Areas |
1.56% |
2.04% |
76.36 |
|
| Better-Off Executives, Inner City Areas |
0.00% |
3.94% |
0.00 |
|
| Comfortable Middle Agers, Mature Home Owning Areas |
19.80% |
13.04% |
151.89 |
|
| Skilled Workers, Home Owning Areas |
5.45% |
12.70% |
42.94 |
|
| New Home Owners, Mature Communities |
5.97% |
8.14% |
73.30 |
|
| White Collar Workers, Better-Off Multi Ethnic Areas |
1.58% |
4.02% |
39.23 |
|
| Older People, Less Prosperous Areas |
0.80% |
3.19% |
25.19 |
|
| Council Estate Residents, Better-Off Homes |
4.09% |
11.31% |
36.16 |
|
| Council Estate Residents, High Unemployment |
0.11% |
3.06% |
3.67 |
|
| Council Estate Residents, Greatest Hardship |
0.00% |
2.52% |
0.00 |
|
| People in Multi-Ethnic, Low-Income Areas |
0.00% |
2.10% |
0.00 |
|
| Unclassified |
0.00% |
0.06% |
0.00 |
|
|
 |
 |
 |
| £0-5K |
4.79% |
9.41% |
50.84 |
|
| £5-10K |
10.61% |
16.63% |
63.76 |
|
| £10-15K |
13.21% |
16.58% |
79.68 |
|
| £15-20K |
12.90% |
13.58% |
95.00 |
|
| £20-25K |
11.29% |
10.39% |
108.60 |
|
| £25-30K |
9.35% |
7.77% |
120.25 |
|
| £30-35K |
7.53% |
5.79% |
130.01 |
|
| £35-40K |
5.98% |
4.33% |
138.08 |
|
| £40-45K |
4.73% |
3.27% |
144.72 |
|
| £45-50K |
3.73% |
2.48% |
150.14 |
|
| £50-55K |
2.94% |
1.90% |
154.57 |
|
| £55-60K |
2.33% |
1.47% |
158.17 |
|
| £60-65K |
1.85% |
1.15% |
161.10 |
|
| £65-70K |
1.48% |
0.91% |
163.47 |
|
| £70-75K |
1.19% |
0.72% |
165.40 |
|
| £75-80K |
0.96% |
0.57% |
166.97 |
|
| £80-85K |
0.78% |
0.46% |
168.23 |
|
| £85-90K |
0.63% |
0.37% |
169.26 |
|
| £90-95K |
0.52% |
0.31% |
170.09 |
|
| £95-100K |
0.43% |
0.25% |
170.75 |
|
| £100K + |
2.32% |
1.34% |
172.40 |
|
|
|

|


|
1992-1997
|
1997-2001
|
|
|
|
| Con |
-14.30% |
| Lab |
9.63% |
| LD |
1.44% |
|
| Con |
-0.16% |
| Lab |
-0.78% |
| LD |
1.60% |
|
|
 |
Robert Jackson
Conservative hold
|
| Con |
 |
19,475 |
39.64% |
| Lab |
 |
13,875 |
28.24% |
| LD |
 |
13,776 |
28.04% |
| Oth |
 |
2,003 |
4.08% |
| Maj |
 |
5,600 |
11.40% |
| Turn |
 |
49,129 |
64.53% |
|
|
 |
Robert Jackson
Conservative hold
|
| L |
Stephen Beer |
13,875 |
28.24% |
| G |
David Brooks-Saxl |
941 |
1.92% |
| LD |
Neil Fawcett |
13,776 |
28.04% |
| C |
Robert Jackson |
19,475 |
39.64% |
| UK |
Nicholas Tolstoy |
1,062 |
2.16% |
|
Candidates representing 5 parties stood for election to this seat.
|
|
 |
Robert Jackson
Conservative
|
| Con |
 |
22,311 |
39.80% |
| Lab |
 |
16,272 |
29.03% |
| LD |
 |
14,822 |
26.44% |
| Ref |
 |
1,549 |
2.76% |
| Oth |
 |
1,105 |
1.97% |
| Maj |
 |
6,039 |
10.77% |
| Turn |
 |
56,059 |
78.23% |
|
|
 |
|
Conservative
|
| Con |
 |
30,575 |
54.10% |
| Lab |
 |
10,955 |
19.40% |
| LD |
 |
14,102 |
25.00% |
| Oth |
 |
867 |
1.50% |
| Maj |
 |
16,473 |
29.20% |
| Turn |
 |
56,499 |
82.80% |
|
|
 |
|

|

