|
Warley
Labour hold

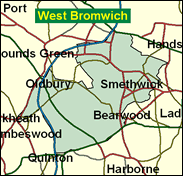
Just west of the Birmingham boundary in the West Midlands Borough of Sandwell is Warley, an unfamiliar name to non-locals but which includes territory rather similar to that adjacent within the big city. Smethwick is mixed race, and inner city in tone like the neighbouring Birmingham Ladywood, Old Warley and Warley Abbey white and middle class, like Quinton in the Edgbaston seat. The politics follow these lines: Labour in the northern half, more Conservative further south, and the predecessors to the seat have been close on occasions; as Smethwick it was infamously won by the Conservatives in an overtly racist campaign in 1964. After 1997, though, the Labour element is well on top, and that is the way it looks like remaining.

John Spellar, Minister of State for Defence, was elected for the precursor seat of Warley West in 1992 having briefly held Birmingham Northfield in 1982/83. Born 1947, he had a public-school (Dulwich) and Oxford (St Edmund Hall) education but is scarcely typical of the genre, being a short, London-brogued, ginger-bearded, pugnacious former EETPU rightwing apparatchik and fixer. He campaigned to purge left-wingers from Labour's NEC and to weight local selection committees to save right-wing MPs and oust left-wing ones. Effortlessly irascible-seeming, in 1997 he was appointed to the MOD as part of the Blair Government's most rightwing ministerial team, and became the first MP to utter the 'c' word in the Commons, when inadvertently inserting an 'n' into the second word in 'spending cuts'.
 |
| Wealthy Achievers, Suburban Areas |
0.02% |
14.99% |
0.14 |
|
| Affluent Greys, Rural Communities |
0.00% |
2.13% |
0.00 |
|
| Prosperous Pensioners, Retirement Areas |
0.00% |
2.49% |
0.00 |
|
| Affluent Executives, Family Areas |
0.00% |
4.43% |
0.00 |
|
| Well-Off Workers, Family Areas |
1.29% |
7.27% |
17.72 |
|
| Affluent Urbanites, Town & City Areas |
0.49% |
2.56% |
19.03 |
|
| Prosperous Professionals, Metropolitan Areas |
0.00% |
2.04% |
0.00 |
|
| Better-Off Executives, Inner City Areas |
0.13% |
3.94% |
3.21 |
|
| Comfortable Middle Agers, Mature Home Owning Areas |
10.50% |
13.04% |
80.51 |
|
| Skilled Workers, Home Owning Areas |
20.54% |
12.70% |
161.68 |
|
| New Home Owners, Mature Communities |
15.75% |
8.14% |
193.47 |
|
| White Collar Workers, Better-Off Multi Ethnic Areas |
1.94% |
4.02% |
48.35 |
|
| Older People, Less Prosperous Areas |
3.93% |
3.19% |
123.22 |
|
| Council Estate Residents, Better-Off Homes |
36.07% |
11.31% |
318.88 |
|
| Council Estate Residents, High Unemployment |
2.73% |
3.06% |
89.01 |
|
| Council Estate Residents, Greatest Hardship |
3.32% |
2.52% |
131.91 |
|
| People in Multi-Ethnic, Low-Income Areas |
3.30% |
2.10% |
157.22 |
|
| Unclassified |
0.00% |
0.06% |
0.00 |
|
|
 |
 |
 |
| £0-5K |
14.69% |
9.41% |
156.00 |
|
| £5-10K |
22.08% |
16.63% |
132.73 |
|
| £10-15K |
19.20% |
16.58% |
115.83 |
|
| £15-20K |
13.89% |
13.58% |
102.25 |
|
| £20-25K |
9.45% |
10.39% |
90.96 |
|
| £25-30K |
6.33% |
7.77% |
81.42 |
|
| £30-35K |
4.25% |
5.79% |
73.29 |
|
| £35-40K |
2.87% |
4.33% |
66.32 |
|
| £40-45K |
1.97% |
3.27% |
60.30 |
|
| £45-50K |
1.37% |
2.48% |
55.09 |
|
| £50-55K |
0.96% |
1.90% |
50.54 |
|
| £55-60K |
0.69% |
1.47% |
46.56 |
|
| £60-65K |
0.50% |
1.15% |
43.05 |
|
| £65-70K |
0.36% |
0.91% |
39.94 |
|
| £70-75K |
0.27% |
0.72% |
37.19 |
|
| £75-80K |
0.20% |
0.57% |
34.72 |
|
| £80-85K |
0.15% |
0.46% |
32.52 |
|
| £85-90K |
0.11% |
0.37% |
30.53 |
|
| £90-95K |
0.09% |
0.31% |
28.74 |
|
| £95-100K |
0.07% |
0.25% |
27.11 |
|
| £100K + |
0.27% |
1.34% |
19.98 |
|
|
|

|


|
1992-1997
|
1997-2001
|
|
|
|
| Con |
-10.23% |
| Lab |
10.70% |
| LD |
-1.69% |
|
| Con |
-1.29% |
| Lab |
-3.30% |
| LD |
0.84% |
|
|
 |
John Spellar
Labour hold
|
| Con |
 |
7,157 |
22.78% |
| Lab |
 |
19,007 |
60.50% |
| LD |
 |
3,315 |
10.55% |
| Oth |
 |
1,936 |
6.16% |
| Maj |
 |
11,850 |
37.72% |
| Turn |
 |
31,415 |
54.10% |
|
|
 |
John Spellar
Labour hold
|
| LD |
Ron Cockings |
3,315 |
10.55% |
| SL |
Harbhajan Dardi |
1,936 |
6.16% |
| C |
Mark Pritchard |
7,157 |
22.78% |
| L |
John Spellar |
19,007 |
60.50% |
|
Candidates representing 4 parties stood for election to this seat.
|
|
 |
John Spellar
Labour
|
| Con |
 |
9,362 |
24.07% |
| Lab |
 |
24,813 |
63.80% |
| LD |
 |
3,777 |
9.71% |
| Ref |
 |
941 |
2.42% |
| Oth |
|
0 |
0.00% |
| Maj |
 |
15,451 |
39.73% |
| Turn |
 |
38,893 |
65.08% |
|
|
 |
|
Labour
|
| Con |
 |
15,334 |
34.30% |
| Lab |
 |
23,743 |
53.10% |
| LD |
 |
5,112 |
11.40% |
| Oth |
 |
561 |
1.30% |
| Maj |
 |
8,409 |
18.80% |
| Turn |
 |
44,750 |
71.50% |
|
|
 |
|

|

