|
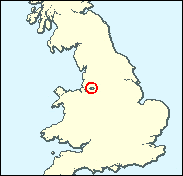
Warrington North
Labour hold

This is the linear successor to the seat where Roy Jenkins lost in the SDP's first ever by-election in the autumn of 1981, a defeat which has almost universally been accepted as a victory (who said the big parties invented spinning?), but the actual winner, Doug Hoyle, remained Labour MP until 1997, when he handed over to Helen Jones. The SDP is no more, its mainstream absorbed into the Liberal Democrats, its Owenite minority humiliated and disbanded; but Labour has never again been troubled in Warrington, a mixture of old Lancashire working class town (curiously transferred to Cheshire) and new housing on the plain near the M62 midway between Liverpool and Manchester.

Helen Jones was elected here in 1997, having been surprisingly selected from an all-women shortlist as a last minute replacement for the winkled-out-with-a-peerage Doug Hoyle, in a seat thought to be earmarked for the rising Blairite star, Yvette Cooper. Born 1954 and educated at the Ursuline Convent, Chester, Chester College and at UCL, Manchester Metropolitan University and Liverpool University, she worked variously as a schoolteacher, as 'Justice and Peace Officer' for the Liverpool Catholic Archdiocese and eventually a solicitor. With a forthright, emphatic mode of delivery, she reflected the feminisation of the PLP in her attack on FCO mandarin Sir David Gore-Booth's use of the term "company wife", but whimsically noted that the word 'socialism' did not feature in her election address.
 |
| Wealthy Achievers, Suburban Areas |
8.47% |
14.99% |
56.50 |
|
| Affluent Greys, Rural Communities |
0.00% |
2.13% |
0.00 |
|
| Prosperous Pensioners, Retirement Areas |
0.60% |
2.49% |
24.28 |
|
| Affluent Executives, Family Areas |
16.49% |
4.43% |
372.63 |
|
| Well-Off Workers, Family Areas |
15.27% |
7.27% |
209.94 |
|
| Affluent Urbanites, Town & City Areas |
0.56% |
2.56% |
21.79 |
|
| Prosperous Professionals, Metropolitan Areas |
0.00% |
2.04% |
0.00 |
|
| Better-Off Executives, Inner City Areas |
0.43% |
3.94% |
10.87 |
|
| Comfortable Middle Agers, Mature Home Owning Areas |
13.33% |
13.04% |
102.25 |
|
| Skilled Workers, Home Owning Areas |
12.75% |
12.70% |
100.36 |
|
| New Home Owners, Mature Communities |
8.48% |
8.14% |
104.12 |
|
| White Collar Workers, Better-Off Multi Ethnic Areas |
0.22% |
4.02% |
5.55 |
|
| Older People, Less Prosperous Areas |
2.31% |
3.19% |
72.54 |
|
| Council Estate Residents, Better-Off Homes |
16.03% |
11.31% |
141.71 |
|
| Council Estate Residents, High Unemployment |
0.74% |
3.06% |
24.11 |
|
| Council Estate Residents, Greatest Hardship |
4.29% |
2.52% |
170.45 |
|
| People in Multi-Ethnic, Low-Income Areas |
0.00% |
2.10% |
0.00 |
|
| Unclassified |
0.03% |
0.06% |
40.14 |
|
|
 |
 |
 |
| £0-5K |
9.19% |
9.41% |
97.63 |
|
| £5-10K |
16.63% |
16.63% |
99.98 |
|
| £10-15K |
16.66% |
16.58% |
100.48 |
|
| £15-20K |
13.69% |
13.58% |
100.80 |
|
| £20-25K |
10.51% |
10.39% |
101.08 |
|
| £25-30K |
7.87% |
7.77% |
101.28 |
|
| £30-35K |
5.87% |
5.79% |
101.36 |
|
| £35-40K |
4.39% |
4.33% |
101.29 |
|
| £40-45K |
3.30% |
3.27% |
101.08 |
|
| £45-50K |
2.50% |
2.48% |
100.75 |
|
| £50-55K |
1.91% |
1.90% |
100.30 |
|
| £55-60K |
1.47% |
1.47% |
99.77 |
|
| £60-65K |
1.14% |
1.15% |
99.17 |
|
| £65-70K |
0.89% |
0.91% |
98.52 |
|
| £70-75K |
0.70% |
0.72% |
97.84 |
|
| £75-80K |
0.56% |
0.57% |
97.14 |
|
| £80-85K |
0.45% |
0.46% |
96.43 |
|
| £85-90K |
0.36% |
0.37% |
95.72 |
|
| £90-95K |
0.29% |
0.31% |
95.02 |
|
| £95-100K |
0.24% |
0.25% |
94.33 |
|
| £100K + |
1.22% |
1.34% |
90.68 |
|
|
|

|


|
1992-1997
|
1997-2001
|
|
|
|
| Con |
-10.90% |
| Lab |
8.90% |
| LD |
-0.94% |
|
| Con |
-1.20% |
| Lab |
-0.35% |
| LD |
3.09% |
|
|
 |
Helen Jones
Labour hold
|
| Con |
 |
8,870 |
22.80% |
| Lab |
 |
24,026 |
61.75% |
| LD |
 |
5,232 |
13.45% |
| Oth |
 |
782 |
2.01% |
| Maj |
 |
15,156 |
38.95% |
| Turn |
 |
38,910 |
53.71% |
|
|
 |
Helen Jones
Labour hold
|
| L |
Helen Jones |
24,026 |
61.75% |
| UK |
Jack Kirkham |
782 |
2.01% |
| LD |
Roy Smith |
5,232 |
13.45% |
| C |
James Usher |
8,870 |
22.80% |
|
Candidates representing 4 parties stood for election to this seat.
|
|
 |
Helen Jones
Labour
|
| Con |
 |
12,300 |
24.00% |
| Lab |
 |
31,827 |
62.10% |
| LD |
 |
5,308 |
10.36% |
| Ref |
 |
1,816 |
3.54% |
| Oth |
|
0 |
0.00% |
| Maj |
 |
19,527 |
38.10% |
| Turn |
 |
51,251 |
70.50% |
|
|
 |
|
Labour
|
| Con |
 |
19,420 |
34.90% |
| Lab |
 |
29,626 |
53.20% |
| LD |
 |
6,307 |
11.30% |
| Oth |
 |
366 |
0.70% |
| Maj |
 |
10,206 |
18.30% |
| Turn |
 |
55,719 |
76.90% |
|
|
 |
|

|

