|
Warrington South
Labour hold

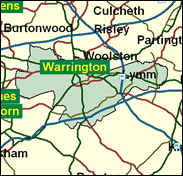
This is the more interesting of the two Warrington seats nowadays, including parts of that Labour inclined town plus some middle class areas across the Mersey in what has always been, and felt like, Cheshire - such a Lymm and Grappenhall, Appleton and Stockton Heath. Despite the creation of the extra Weaver Vale seat in 1997, which was thought by many (including the then Warrington South MP Mike Hall) to take the best parts of Warrington South, Labour looks safe in this redrawn division despite its ascribed marginal status. It would take a swing of nearly ten pc to end Helen Southworth's short career in the Commons, and at the same time Tony Blair's period as Prime Minister. the evidence available suggests that these things will not happen. In the Euro-elections of 1999, when the Conservatives achieved their national high water mark in the whole of the decade and led within most of the 659 constituencies, they were less than one pc ahead here. In local elections, the picture is muddied by Liberal Democrat success which is not translated into general election preferences - they polled just 13pc in 1997. It all adds up to a quiet re-election for Helen Southworth.

Helen Southworth, elected here in 1997 after selection from an all-women shortlist, is a former voluntary sector worker, latterly with Age Concern, who campaigns on the disabled, in-town shopping centres, regional government, violence against women and opposed the transfer of the synchrocyclotron from this constituency to Oxfordshire. Born in 1956, she was educated at Larkhill Convent, Preston, and Lancaster University. In one of the photographs of Tony Blair surrounded by his Babes on the steps of Church House, Westminster in May 1997, she is the one right next to him, inadvertently sticking her tongue out.
 |
| Wealthy Achievers, Suburban Areas |
28.64% |
14.99% |
191.02 |
|
| Affluent Greys, Rural Communities |
0.00% |
2.13% |
0.00 |
|
| Prosperous Pensioners, Retirement Areas |
0.29% |
2.49% |
11.63 |
|
| Affluent Executives, Family Areas |
6.34% |
4.43% |
143.30 |
|
| Well-Off Workers, Family Areas |
17.77% |
7.27% |
244.30 |
|
| Affluent Urbanites, Town & City Areas |
0.70% |
2.56% |
27.35 |
|
| Prosperous Professionals, Metropolitan Areas |
0.11% |
2.04% |
5.58 |
|
| Better-Off Executives, Inner City Areas |
0.64% |
3.94% |
16.21 |
|
| Comfortable Middle Agers, Mature Home Owning Areas |
11.96% |
13.04% |
91.76 |
|
| Skilled Workers, Home Owning Areas |
13.51% |
12.70% |
106.38 |
|
| New Home Owners, Mature Communities |
6.69% |
8.14% |
82.10 |
|
| White Collar Workers, Better-Off Multi Ethnic Areas |
2.87% |
4.02% |
71.37 |
|
| Older People, Less Prosperous Areas |
3.06% |
3.19% |
95.92 |
|
| Council Estate Residents, Better-Off Homes |
6.33% |
11.31% |
55.94 |
|
| Council Estate Residents, High Unemployment |
0.81% |
3.06% |
26.39 |
|
| Council Estate Residents, Greatest Hardship |
0.28% |
2.52% |
11.11 |
|
| People in Multi-Ethnic, Low-Income Areas |
0.00% |
2.10% |
0.00 |
|
| Unclassified |
0.00% |
0.06% |
0.00 |
|
|
 |
 |
 |
| £0-5K |
6.36% |
9.41% |
67.58 |
|
| £5-10K |
13.29% |
16.63% |
79.89 |
|
| £10-15K |
14.89% |
16.58% |
89.83 |
|
| £15-20K |
13.31% |
13.58% |
98.00 |
|
| £20-25K |
10.92% |
10.39% |
105.07 |
|
| £25-30K |
8.66% |
7.77% |
111.37 |
|
| £30-35K |
6.78% |
5.79% |
117.00 |
|
| £35-40K |
5.29% |
4.33% |
121.99 |
|
| £40-45K |
4.12% |
3.27% |
126.32 |
|
| £45-50K |
3.23% |
2.48% |
130.02 |
|
| £50-55K |
2.54% |
1.90% |
133.13 |
|
| £55-60K |
2.00% |
1.47% |
135.68 |
|
| £60-65K |
1.59% |
1.15% |
137.74 |
|
| £65-70K |
1.26% |
0.91% |
139.36 |
|
| £70-75K |
1.01% |
0.72% |
140.59 |
|
| £75-80K |
0.81% |
0.57% |
141.50 |
|
| £80-85K |
0.66% |
0.46% |
142.11 |
|
| £85-90K |
0.53% |
0.37% |
142.49 |
|
| £90-95K |
0.44% |
0.31% |
142.66 |
|
| £95-100K |
0.36% |
0.25% |
142.65 |
|
| £100K + |
1.87% |
1.34% |
138.83 |
|
|
|

|


|
1992-1997
|
1997-2001
|
|
|
|
| Con |
-13.18% |
| Lab |
11.34% |
| LD |
0.07% |
|
| Con |
0.50% |
| Lab |
-2.88% |
| LD |
3.24% |
|
|
 |
Helen Southworth
Labour hold
|
| Con |
 |
15,022 |
33.02% |
| Lab |
 |
22,409 |
49.26% |
| LD |
 |
7,419 |
16.31% |
| Oth |
 |
637 |
1.40% |
| Maj |
 |
7,387 |
16.24% |
| Turn |
 |
45,487 |
61.23% |
|
|
 |
Helen Southworth
Labour hold
|
| LD |
Roger Barlow |
7,419 |
16.31% |
| UK |
Joan Kelley |
637 |
1.40% |
| C |
Caroline Mosley |
15,022 |
33.02% |
| L |
Helen Southworth |
22,409 |
49.26% |
|
Candidates representing 4 parties stood for election to this seat.
|
|
 |
Helen Southworth
Labour gain
|
| Con |
 |
17,914 |
32.52% |
| Lab |
 |
28,721 |
52.14% |
| LD |
 |
7,199 |
13.07% |
| Ref |
 |
1,082 |
1.96% |
| Oth |
 |
166 |
0.30% |
| Maj |
 |
10,807 |
19.62% |
| Turn |
 |
55,082 |
76.23% |
|
|
 |
|
Conservative
|
| Con |
 |
25,698 |
45.70% |
| Lab |
 |
22,945 |
40.80% |
| LD |
 |
7,316 |
13.00% |
| Oth |
 |
290 |
0.50% |
| Maj |
 |
2,753 |
4.90% |
| Turn |
 |
56,249 |
81.14% |
|
|
 |
|

|

