|
Warwick & Leamington
Labour hold

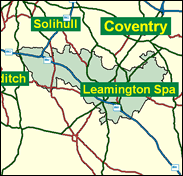
This West Midlands seat is widely regarded as one of the most likely regains for the Tories in a 2001 General Election. It can be placed fairly clearly in its correct approximate position in the target list: 22nd most vulnerable to the Tories in 1997 results, 20th according the European election breakdown of June 1999; however this should not be regarded as an automatic shoo-in from the new Tory challenger David Campbell-Bannerman. Labour still have some very strong areas, as may be seen in the most recent local elections in Warwick District, when they won 16 councillors, some in very safe wards like Brunswick and Willes (southern Leamington Spa) and Warwick North and West. The Conservatives fight back strongly in the smaller villages, but there are mixed results in places like Milverton, Bishop's Tachbrook and Radford Semele. The fact is that it was Kenilworth, now departed to join Rugby, which was the real Conservative stronghold here and James Plaskitt may just win again in another very good Labour general election year.

James Plaskitt, who won the seat in 1997, has lived a parliamentary life of relative obscurity, as a loyalist who has stepped out of line only minimally as when dubbing the Dome "a white elephant". Backing PR, he was born 1954, educated at Pilgrim School, Bedford, and University College, Oxford, and initially taught politics at Brunel and Oxford Universities and then worked as a business consultant. Expecting to reverse the aberration of the Conservatives' loss of Sir Anthony Eden's former seat is the bearer of another famous prime ministerial surname, David Campbell Bannerman. An ex-Chairman of the Bow Group and PR man, formerly with his own company but now with the Association of Train Operating Companies, he was born in 1960 in Bombay and educated at Bryanston, and Edinburgh and Pennsylvania Universities. He worked as political adviser to Sir Patrick Mayhew after four years on the council in Mayhew's Tunbridge Wells constituency. He had a trial run in Glasgow Rutherglen in 1997. His great, great, great uncle Sir Henry Campbell-Bannerman's Downing Street desk is in his family's possesion.
 |
| Wealthy Achievers, Suburban Areas |
24.02% |
14.99% |
160.17 |
|
| Affluent Greys, Rural Communities |
0.05% |
2.13% |
2.30 |
|
| Prosperous Pensioners, Retirement Areas |
4.30% |
2.49% |
173.12 |
|
| Affluent Executives, Family Areas |
4.61% |
4.43% |
104.11 |
|
| Well-Off Workers, Family Areas |
7.54% |
7.27% |
103.65 |
|
| Affluent Urbanites, Town & City Areas |
3.26% |
2.56% |
127.12 |
|
| Prosperous Professionals, Metropolitan Areas |
1.09% |
2.04% |
53.35 |
|
| Better-Off Executives, Inner City Areas |
5.36% |
3.94% |
135.91 |
|
| Comfortable Middle Agers, Mature Home Owning Areas |
14.74% |
13.04% |
113.02 |
|
| Skilled Workers, Home Owning Areas |
5.92% |
12.70% |
46.59 |
|
| New Home Owners, Mature Communities |
8.04% |
8.14% |
98.78 |
|
| White Collar Workers, Better-Off Multi Ethnic Areas |
5.11% |
4.02% |
127.16 |
|
| Older People, Less Prosperous Areas |
4.39% |
3.19% |
137.83 |
|
| Council Estate Residents, Better-Off Homes |
10.07% |
11.31% |
89.01 |
|
| Council Estate Residents, High Unemployment |
0.47% |
3.06% |
15.22 |
|
| Council Estate Residents, Greatest Hardship |
1.00% |
2.52% |
39.69 |
|
| People in Multi-Ethnic, Low-Income Areas |
0.00% |
2.10% |
0.00 |
|
| Unclassified |
0.04% |
0.06% |
62.06 |
|
|
 |
 |
 |
| £0-5K |
7.85% |
9.41% |
83.42 |
|
| £5-10K |
14.84% |
16.63% |
89.19 |
|
| £10-15K |
15.73% |
16.58% |
94.90 |
|
| £15-20K |
13.51% |
13.58% |
99.46 |
|
| £20-25K |
10.71% |
10.39% |
103.03 |
|
| £25-30K |
8.23% |
7.77% |
105.89 |
|
| £30-35K |
6.27% |
5.79% |
108.25 |
|
| £35-40K |
4.78% |
4.33% |
110.26 |
|
| £40-45K |
3.66% |
3.27% |
112.00 |
|
| £45-50K |
2.82% |
2.48% |
113.53 |
|
| £50-55K |
2.19% |
1.90% |
114.91 |
|
| £55-60K |
1.71% |
1.47% |
116.15 |
|
| £60-65K |
1.35% |
1.15% |
117.28 |
|
| £65-70K |
1.07% |
0.91% |
118.31 |
|
| £70-75K |
0.86% |
0.72% |
119.26 |
|
| £75-80K |
0.69% |
0.57% |
120.14 |
|
| £80-85K |
0.56% |
0.46% |
120.96 |
|
| £85-90K |
0.46% |
0.37% |
121.73 |
|
| £90-95K |
0.37% |
0.31% |
122.44 |
|
| £95-100K |
0.31% |
0.25% |
123.12 |
|
| £100K + |
1.71% |
1.34% |
126.90 |
|
|
|

|


|
1992-1997
|
1997-2001
|
|
|
|
| Con |
-10.64% |
| Lab |
13.31% |
| LD |
-5.23% |
|
| Con |
-1.21% |
| Lab |
4.25% |
| LD |
-0.73% |
|
|
 |
James Plaskitt
Labour hold
|
| Con |
 |
20,155 |
37.65% |
| Lab |
 |
26,108 |
48.76% |
| LD |
 |
5,964 |
11.14% |
| Oth |
 |
1,312 |
2.45% |
| Maj |
 |
5,953 |
11.12% |
| Turn |
 |
53,539 |
65.77% |
|
|
 |
James Plaskitt
Labour hold
|
| C |
David Bannerman |
20,155 |
37.65% |
| LD |
Linda Forbes |
5,964 |
11.14% |
| SA |
Clare Kime |
664 |
1.24% |
| L |
James Plaskitt |
26,108 |
48.76% |
| UK |
Greville Warwick |
648 |
1.21% |
|
Candidates representing 5 parties stood for election to this seat.
|
|
 |
James Plaskitt
Labour gain
|
| Con |
 |
23,349 |
38.86% |
| Lab |
 |
26,747 |
44.51% |
| LD |
 |
7,133 |
11.87% |
| Ref |
 |
1,484 |
2.47% |
| Oth |
 |
1,378 |
2.29% |
| Maj |
 |
3,398 |
5.65% |
| Turn |
 |
60,091 |
75.71% |
|
|
 |
|
Conservative
|
| Con |
 |
31,028 |
49.50% |
| Lab |
 |
19,564 |
31.20% |
| LD |
 |
10,729 |
17.10% |
| Oth |
 |
1,303 |
2.10% |
| Maj |
 |
11,464 |
18.30% |
| Turn |
 |
62,624 |
80.44% |
|
|
 |
|

|

