|
Warwickshire North
Labour hold

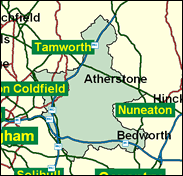
A very close marginal in 1992, this constituency is now effectively safe for the high-profile Home Office Minister Mike O'Brien, who is thought to be potential material for a future Labour Cabinet. The deciding factor in the last ten years has been Labour's strength not only in the largest town, Bedworth near Nuneaton, but in large industrial villages which belie the culture and preferences of the Warwickshire coalfield, although that is long since defunct: places like Arley and Baddesley Ensor, and the larger Atherstone just off the A5. This is an unglamorous part of the world, but it and places like it are as valuable a part of the coalition that elects and will probably re-elect Tony Blair's government as more spectacular and metropolitan seats like, to name but a few, Basildon, Birmingham Edgbaston, Enfield Southgate, Hammersmith and Fulham, Wimbledon, Edinburgh Pentlands, Hove, Cardiff Central, Bristol West and Shipley.

Mike O'Brien, junior minister at the Home Office, was first elected in 1992, and has recently been dubbed (by The Telegraph) as "so quiet it is easy to assume he is harmless". Yet by insisting he had received a phone call from Peter Mandelson in the Hinduja passport affair, secured that minister's resignation. A dapper solicitor of Irish good looks, born in 1954, he attended the Blessed Edward Oldcombe (RC) School, Worcester, Worcester Technical College and North Staffs Polytechnic. He was relieved in 1999 of the hornet's nest of immigration control, swapping it for the political football of the this-year-next-year-sometime-never banning of hunting.
 |
| Wealthy Achievers, Suburban Areas |
11.22% |
14.99% |
74.84 |
|
| Affluent Greys, Rural Communities |
0.06% |
2.13% |
2.98 |
|
| Prosperous Pensioners, Retirement Areas |
0.18% |
2.49% |
7.13 |
|
| Affluent Executives, Family Areas |
6.36% |
4.43% |
143.64 |
|
| Well-Off Workers, Family Areas |
11.98% |
7.27% |
164.73 |
|
| Affluent Urbanites, Town & City Areas |
0.24% |
2.56% |
9.29 |
|
| Prosperous Professionals, Metropolitan Areas |
0.00% |
2.04% |
0.00 |
|
| Better-Off Executives, Inner City Areas |
0.00% |
3.94% |
0.00 |
|
| Comfortable Middle Agers, Mature Home Owning Areas |
11.63% |
13.04% |
89.18 |
|
| Skilled Workers, Home Owning Areas |
29.32% |
12.70% |
230.81 |
|
| New Home Owners, Mature Communities |
14.38% |
8.14% |
176.59 |
|
| White Collar Workers, Better-Off Multi Ethnic Areas |
0.00% |
4.02% |
0.00 |
|
| Older People, Less Prosperous Areas |
3.64% |
3.19% |
114.36 |
|
| Council Estate Residents, Better-Off Homes |
10.72% |
11.31% |
94.82 |
|
| Council Estate Residents, High Unemployment |
0.24% |
3.06% |
7.71 |
|
| Council Estate Residents, Greatest Hardship |
0.00% |
2.52% |
0.17 |
|
| People in Multi-Ethnic, Low-Income Areas |
0.00% |
2.10% |
0.00 |
|
| Unclassified |
0.03% |
0.06% |
40.60 |
|
|
 |
 |
 |
| £0-5K |
8.53% |
9.41% |
90.59 |
|
| £5-10K |
15.90% |
16.63% |
95.62 |
|
| £10-15K |
16.72% |
16.58% |
100.86 |
|
| £15-20K |
14.17% |
13.58% |
104.33 |
|
| £20-25K |
11.02% |
10.39% |
106.07 |
|
| £25-30K |
8.28% |
7.77% |
106.48 |
|
| £30-35K |
6.14% |
5.79% |
105.95 |
|
| £35-40K |
4.54% |
4.33% |
104.79 |
|
| £40-45K |
3.37% |
3.27% |
103.22 |
|
| £45-50K |
2.52% |
2.48% |
101.42 |
|
| £50-55K |
1.89% |
1.90% |
99.48 |
|
| £55-60K |
1.44% |
1.47% |
97.50 |
|
| £60-65K |
1.10% |
1.15% |
95.51 |
|
| £65-70K |
0.85% |
0.91% |
93.56 |
|
| £70-75K |
0.66% |
0.72% |
91.67 |
|
| £75-80K |
0.52% |
0.57% |
89.84 |
|
| £80-85K |
0.41% |
0.46% |
88.10 |
|
| £85-90K |
0.32% |
0.37% |
86.43 |
|
| £90-95K |
0.26% |
0.31% |
84.84 |
|
| £95-100K |
0.21% |
0.25% |
83.32 |
|
| £100K + |
1.01% |
1.34% |
75.39 |
|
|
|

|


|
1992-1997
|
1997-2001
|
|
|
|
| Con |
-12.44% |
| Lab |
12.29% |
| LD |
-2.85% |
|
| Con |
1.23% |
| Lab |
-4.29% |
| LD |
3.93% |
|
|
 |
Mike O'Brien
Labour hold
|
| Con |
 |
14,384 |
32.39% |
| Lab |
 |
24,023 |
54.09% |
| LD |
 |
5,052 |
11.38% |
| Oth |
 |
950 |
2.14% |
| Maj |
 |
9,639 |
21.71% |
| Turn |
 |
44,409 |
100.00% |
|
|
 |
Mike O'Brien
Labour hold
|
| UK |
John Flynn |
950 |
2.14% |
| L |
Mike O'Brien |
24,023 |
54.09% |
| C |
Geoff Parsons |
14,384 |
32.39% |
| LD |
William Powell |
5,052 |
11.38% |
|
Candidates representing 4 parties stood for election to this seat.
|
|
 |
Michael O'Brien
Labour
|
| Con |
 |
16,902 |
31.16% |
| Lab |
 |
31,669 |
58.39% |
| LD |
 |
4,040 |
7.45% |
| Ref |
 |
917 |
1.69% |
| Oth |
 |
711 |
1.31% |
| Maj |
 |
14,767 |
27.23% |
| Turn |
 |
54,239 |
74.71% |
|
|
 |
|
Labour
|
| Con |
 |
26,124 |
43.60% |
| Lab |
 |
27,577 |
46.10% |
| LD |
 |
6,161 |
10.30% |
| Oth |
|
0 |
0.00% |
| Maj |
 |
1,453 |
2.40% |
| Turn |
 |
59,862 |
82.78% |
|
|
 |
|

|

