|
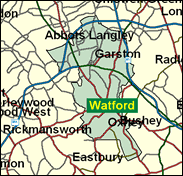
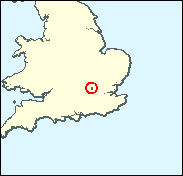
Watford
Labour hold

The fabled gateway to the north of England (only people from the far south could see things that way) is a critical swing marginal. Claire Ward, who is not yet 30 years of age, became the youngest female MP in gaining the seat in 1997. Her lead was 10.5pc, just a little less than Labour's national advantage. If the Conservative Michael McManus wins at the next general election, it is likely that at least 60 other Labour seats will fall too, reducing Mr Blair's lead to a maximum of 60, which leaves him vulnerable to rebellions and to the gradual encroachment of by-election losses. This assumes no differential swing on regional grounds. However, there is evidence that the Labour vote is holding up better in the South East than in some other regions (West Midlands, North West, Yorkshire) and they did better than average in the 1999 Euro-elections and the 2000 local elections in Watford Borough (when voting was allowed at the weekend rather than just on Thursday as usual - this made no significant impact). Claire Ward is probably the narrow favourite - to win narrowly.

Bob Blizzard was elected in 1997 as a standard product of the Labour landslide: a 40-something schoolteacher and local councillor, in his case council leader. A burly, vigorous speaker, he was born in 1950, attended Culford School, Bury St. Edmunds, and Birmingham University and taught English for 25 years. An assiduous campaigner on local issues such as poor transport and fishing, he loyally defends government policy across a broad front, and deplores the damaging impact on English-brewed beer of bootlegging from the continent.
 |
| Wealthy Achievers, Suburban Areas |
15.23% |
14.99% |
101.55 |
|
| Affluent Greys, Rural Communities |
0.00% |
2.13% |
0.00 |
|
| Prosperous Pensioners, Retirement Areas |
1.69% |
2.49% |
68.02 |
|
| Affluent Executives, Family Areas |
1.79% |
4.43% |
40.39 |
|
| Well-Off Workers, Family Areas |
12.81% |
7.27% |
176.05 |
|
| Affluent Urbanites, Town & City Areas |
6.37% |
2.56% |
248.33 |
|
| Prosperous Professionals, Metropolitan Areas |
2.19% |
2.04% |
107.42 |
|
| Better-Off Executives, Inner City Areas |
1.94% |
3.94% |
49.17 |
|
| Comfortable Middle Agers, Mature Home Owning Areas |
15.54% |
13.04% |
119.21 |
|
| Skilled Workers, Home Owning Areas |
17.10% |
12.70% |
134.59 |
|
| New Home Owners, Mature Communities |
9.43% |
8.14% |
115.81 |
|
| White Collar Workers, Better-Off Multi Ethnic Areas |
5.15% |
4.02% |
128.16 |
|
| Older People, Less Prosperous Areas |
1.23% |
3.19% |
38.72 |
|
| Council Estate Residents, Better-Off Homes |
7.17% |
11.31% |
63.38 |
|
| Council Estate Residents, High Unemployment |
0.97% |
3.06% |
31.54 |
|
| Council Estate Residents, Greatest Hardship |
0.67% |
2.52% |
26.53 |
|
| People in Multi-Ethnic, Low-Income Areas |
0.73% |
2.10% |
34.73 |
|
| Unclassified |
0.00% |
0.06% |
0.00 |
|
|
 |
|
|
| £0-5K |
5.08% |
9.41% |
53.92 |
|
| £5-10K |
10.52% |
16.63% |
63.26 |
|
| £10-15K |
12.74% |
16.58% |
76.86 |
|
| £15-20K |
12.36% |
13.58% |
90.96 |
|
| £20-25K |
10.84% |
10.39% |
104.32 |
|
| £25-30K |
9.05% |
7.77% |
116.46 |
|
| £30-35K |
7.37% |
5.79% |
127.24 |
|
| £35-40K |
5.92% |
4.33% |
136.70 |
|
| £40-45K |
4.73% |
3.27% |
144.93 |
|
| £45-50K |
3.77% |
2.48% |
152.07 |
|
| £50-55K |
3.01% |
1.90% |
158.24 |
|
| £55-60K |
2.41% |
1.47% |
163.58 |
|
| £60-65K |
1.94% |
1.15% |
168.19 |
|
| £65-70K |
1.56% |
0.91% |
172.19 |
|
| £70-75K |
1.26% |
0.72% |
175.65 |
|
| £75-80K |
1.03% |
0.57% |
178.64 |
|
| £80-85K |
0.84% |
0.46% |
181.24 |
|
| £85-90K |
0.69% |
0.37% |
183.50 |
|
| £90-95K |
0.57% |
0.31% |
185.45 |
|
| £95-100K |
0.47% |
0.25% |
187.15 |
|
| £100K + |
2.59% |
1.34% |
192.42 |
|
|
|
|


|
1992-1997
|
1997-2001
|
|
|
|
| Con |
-13.29% |
| Lab |
11.29% |
| LD |
-0.01% |
|
| Con |
-1.52% |
| Lab |
-0.03% |
| LD |
0.66% |
|
|
|
Claire Ward
Labour hold
|
| Con |
 |
15,437 |
33.29% |
| Lab |
 |
20,992 |
45.27% |
| LD |
 |
8,088 |
17.44% |
| Oth |
 |
1,855 |
4.00% |
| Maj |
 |
5,555 |
11.98% |
| Turn |
|
46,372 |
61.24% |
|
|
|
Claire Ward
Labour hold
|
| SA |
Jon Berry |
420 |
0.91% |
| LD |
Duncan Hames |
8,088 |
17.44% |
| G |
Denise Kingsley |
900 |
1.94% |
| C |
Michael McManus |
15,437 |
33.29% |
| UK |
Edmund Stewart-Mole |
535 |
1.15% |
| L |
Claire Ward |
20,992 |
45.27% |
|
Candidates representing 6 parties stood for election to this seat.
|
|
|
Claire Ward
Labour gain
|
| Con |
|
19,227 |
34.81% |
| Lab |
|
25,019 |
45.29% |
| LD |
|
9,272 |
16.79% |
| Ref |
 |
1,484 |
2.69% |
| Oth |
|
234 |
0.42% |
| Maj |
|
5,792 |
10.49% |
| Turn |
|
55,236 |
74.63% |
|
|
|
|
Conservative
|
| Con |
|
28,159 |
48.10% |
| Lab |
|
19,896 |
34.00% |
| LD |
|
9,807 |
16.80% |
| Oth |
|
673 |
1.10% |
| Maj |
|
8,263 |
14.10% |
| Turn |
|
58,535 |
81.08% |
|
|
|
|
|