|
Waveney
Labour hold

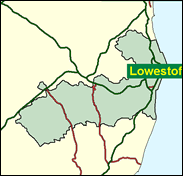
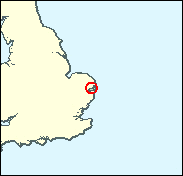
Although gained by Labour's Bob Blizzard in 1997, defeating the sitting Conservative David Porter, the Waveney seat (the furthest east in England, based as it is on the Suffolk port of Lowestoft) is really on the very fringes of marginal status. Blizzard achieved no less than 56pc of the vote and a lead of over 20pc, usually the outside criterion for any kind of marginality. The Tories only just received the most votes here in the June 1999 Euro-elections, a high water mark for them nationally, despite the fact that seaside areas were among the best areas for the Right. If the Conservatives were to take this seat, they would not only wipe out the Labour overall majority; they themselves would become the largest party in the Commons. It may be some considerable while before that happens.

Bob Blizzard was elected in 1997 as a standard product of the Labour landslide: a 40-something schoolteacher and local councillor, in his case council leader. A burly, vigorous speaker, he was born in 1950, attended Culford School, Bury St. Edmunds, and Birmingham University and taught English for 25 years. An assiduous campaigner on local issues such as poor transport and fishing, he loyally defends government policy across a broad front, and deplores the damaging impact on English-brewed beer of bootlegging from the continent.
 |
| Wealthy Achievers, Suburban Areas |
10.43% |
14.99% |
69.55 |
|
| Affluent Greys, Rural Communities |
3.62% |
2.13% |
170.48 |
|
| Prosperous Pensioners, Retirement Areas |
6.09% |
2.49% |
245.11 |
|
| Affluent Executives, Family Areas |
2.88% |
4.43% |
65.05 |
|
| Well-Off Workers, Family Areas |
4.71% |
7.27% |
64.70 |
|
| Affluent Urbanites, Town & City Areas |
0.36% |
2.56% |
14.12 |
|
| Prosperous Professionals, Metropolitan Areas |
0.00% |
2.04% |
0.00 |
|
| Better-Off Executives, Inner City Areas |
2.89% |
3.94% |
73.20 |
|
| Comfortable Middle Agers, Mature Home Owning Areas |
16.61% |
13.04% |
127.37 |
|
| Skilled Workers, Home Owning Areas |
21.59% |
12.70% |
169.93 |
|
| New Home Owners, Mature Communities |
14.25% |
8.14% |
175.04 |
|
| White Collar Workers, Better-Off Multi Ethnic Areas |
2.78% |
4.02% |
69.15 |
|
| Older People, Less Prosperous Areas |
3.99% |
3.19% |
125.33 |
|
| Council Estate Residents, Better-Off Homes |
8.54% |
11.31% |
75.47 |
|
| Council Estate Residents, High Unemployment |
0.71% |
3.06% |
23.24 |
|
| Council Estate Residents, Greatest Hardship |
0.55% |
2.52% |
21.88 |
|
| People in Multi-Ethnic, Low-Income Areas |
0.00% |
2.10% |
0.00 |
|
| Unclassified |
0.00% |
0.06% |
0.00 |
|
|
 |
 |
 |
| £0-5K |
13.65% |
9.41% |
145.02 |
|
| £5-10K |
21.79% |
16.63% |
131.00 |
|
| £10-15K |
19.26% |
16.58% |
116.17 |
|
| £15-20K |
14.00% |
13.58% |
103.04 |
|
| £20-25K |
9.55% |
10.39% |
91.93 |
|
| £25-30K |
6.43% |
7.77% |
82.67 |
|
| £30-35K |
4.34% |
5.79% |
74.95 |
|
| £35-40K |
2.97% |
4.33% |
68.47 |
|
| £40-45K |
2.06% |
3.27% |
63.01 |
|
| £45-50K |
1.45% |
2.48% |
58.37 |
|
| £50-55K |
1.04% |
1.90% |
54.40 |
|
| £55-60K |
0.75% |
1.47% |
50.97 |
|
| £60-65K |
0.55% |
1.15% |
47.98 |
|
| £65-70K |
0.41% |
0.91% |
45.37 |
|
| £70-75K |
0.31% |
0.72% |
43.07 |
|
| £75-80K |
0.24% |
0.57% |
41.02 |
|
| £80-85K |
0.18% |
0.46% |
39.20 |
|
| £85-90K |
0.14% |
0.37% |
37.56 |
|
| £90-95K |
0.11% |
0.31% |
36.08 |
|
| £95-100K |
0.09% |
0.25% |
34.75 |
|
| £100K + |
0.39% |
1.34% |
28.77 |
|
|
|

|


|
1992-1997
|
1997-2001
|
|
|
|
| Con |
-12.74% |
| Lab |
16.55% |
| LD |
-3.87% |
|
| Con |
-1.69% |
| Lab |
-5.55% |
| LD |
2.46% |
|
|
 |
Bob Blizzard
Labour hold
|
| Con |
 |
15,361 |
32.57% |
| Lab |
 |
23,914 |
50.70% |
| LD |
 |
5,370 |
11.39% |
| Oth |
 |
2,522 |
5.35% |
| Maj |
 |
8,553 |
18.13% |
| Turn |
 |
47,167 |
61.59% |
|
|
 |
Bob Blizzard
Labour hold
|
| UK |
Brian Aylett |
1,097 |
2.33% |
| L |
Bob Blizzard |
23,914 |
50.70% |
| G |
Graham Elliot |
983 |
2.08% |
| SA |
Rupert Mallin |
442 |
0.94% |
| C |
Lee Scott |
15,361 |
32.57% |
| LD |
David Young |
5,370 |
11.39% |
|
Candidates representing 6 parties stood for election to this seat.
|
|
 |
Robert Blizzard
Labour gain
|
| Con |
 |
19,393 |
34.26% |
| Lab |
 |
31,846 |
56.25% |
| LD |
 |
5,054 |
8.93% |
| Ref |
|
0 |
0.00% |
| Oth |
 |
318 |
0.56% |
| Maj |
 |
12,453 |
22.00% |
| Turn |
 |
56,611 |
75.21% |
|
|
 |
|
Conservative
|
| Con |
 |
28,352 |
47.00% |
| Lab |
 |
23,976 |
39.70% |
| LD |
 |
7,728 |
12.80% |
| Oth |
 |
265 |
0.40% |
| Maj |
 |
4,376 |
7.30% |
| Turn |
 |
60,321 |
81.16% |
|
|
 |
|

|

