|
Wealden
Conservative hold

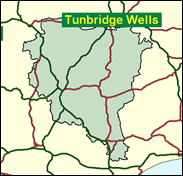
One of the most Conservative areas in the whole of England, Wealden in East Sussex was held by its veteran and now retiring MP Sir Geoffrey Johnson Smith, that smoothest of operators, not through any absence of tactical voting by the party's opponents but by its own fundamental strength. Even after a 12pc drop in the Tory share in 1997 they were still within 0.2pc of an absolute majority. That distinction was achieved in the Euro elections in 1999, even though the UK Independence slate also polled a double figure percentage within this seat, and the Tories took overall control of the Wealden district in the local elections of the same year. This seat includes Crowborough, Hailsham, Uckfield and Ashdown Forest, which is the site for A.A.Milne's characters from Winnie the Pooh: the author lived in Hartfield within the seat. It would be a very blustery political day indeed if the Conservative dominance were blown away in Wealden.

Charles Hendry, one of five former MPs selected to fight Conservative-held seats, has replaced the veteran Sir Geoffrey Johnson-Smith. Previously MP for High Peak (1992-97), he has migrated to the lower peaks of the Weald for what will be his fourth parliamentary contest in a different seat, having earlier fought Clackmannan (1983) and Mansfield (1987). A pink and plump-faced son of a stockbroker, he was born in 1959 and educated at Rugby and Edinburgh University and worked in PR at Ogilvy & Mather before joining the inside track of special advisers, in his case to Social Security Secretary Tony Newton. More important are his links with William Hague, as his former PPS and as his Chief of Staff from 1997 to 1998. In 1994 he was one of 44 Tory MPs voting to lower the homosexual age of consent to 16.
 |
| Wealthy Achievers, Suburban Areas |
43.84% |
14.99% |
292.39 |
|
| Affluent Greys, Rural Communities |
0.77% |
2.13% |
36.10 |
|
| Prosperous Pensioners, Retirement Areas |
3.91% |
2.49% |
157.45 |
|
| Affluent Executives, Family Areas |
8.70% |
4.43% |
196.65 |
|
| Well-Off Workers, Family Areas |
7.92% |
7.27% |
108.91 |
|
| Affluent Urbanites, Town & City Areas |
0.25% |
2.56% |
9.85 |
|
| Prosperous Professionals, Metropolitan Areas |
0.00% |
2.04% |
0.00 |
|
| Better-Off Executives, Inner City Areas |
0.00% |
3.94% |
0.00 |
|
| Comfortable Middle Agers, Mature Home Owning Areas |
22.62% |
13.04% |
173.46 |
|
| Skilled Workers, Home Owning Areas |
2.56% |
12.70% |
20.17 |
|
| New Home Owners, Mature Communities |
5.08% |
8.14% |
62.41 |
|
| White Collar Workers, Better-Off Multi Ethnic Areas |
0.24% |
4.02% |
6.06 |
|
| Older People, Less Prosperous Areas |
0.84% |
3.19% |
26.36 |
|
| Council Estate Residents, Better-Off Homes |
2.15% |
11.31% |
18.97 |
|
| Council Estate Residents, High Unemployment |
0.44% |
3.06% |
14.30 |
|
| Council Estate Residents, Greatest Hardship |
0.61% |
2.52% |
24.06 |
|
| People in Multi-Ethnic, Low-Income Areas |
0.00% |
2.10% |
0.00 |
|
| Unclassified |
0.07% |
0.06% |
106.70 |
|
|
 |
|
|
| £0-5K |
5.45% |
9.41% |
57.85 |
|
| £5-10K |
11.66% |
16.63% |
70.12 |
|
| £10-15K |
13.76% |
16.58% |
83.00 |
|
| £15-20K |
12.92% |
13.58% |
95.08 |
|
| £20-25K |
11.01% |
10.39% |
105.95 |
|
| £25-30K |
8.98% |
7.77% |
115.55 |
|
| £30-35K |
7.18% |
5.79% |
123.96 |
|
| £35-40K |
5.69% |
4.33% |
131.30 |
|
| £40-45K |
4.50% |
3.27% |
137.69 |
|
| £45-50K |
3.56% |
2.48% |
143.25 |
|
| £50-55K |
2.82% |
1.90% |
148.10 |
|
| £55-60K |
2.25% |
1.47% |
152.34 |
|
| £60-65K |
1.80% |
1.15% |
156.05 |
|
| £65-70K |
1.44% |
0.91% |
159.30 |
|
| £70-75K |
1.17% |
0.72% |
162.15 |
|
| £75-80K |
0.95% |
0.57% |
164.66 |
|
| £80-85K |
0.77% |
0.46% |
166.87 |
|
| £85-90K |
0.63% |
0.37% |
168.81 |
|
| £90-95K |
0.52% |
0.31% |
170.52 |
|
| £95-100K |
0.43% |
0.25% |
172.03 |
|
| £100K + |
2.38% |
1.34% |
176.91 |
|
|
|
|


|
1992-1997
|
1997-2001
|
|
|
|
| Con |
-11.92% |
| Lab |
8.03% |
| LD |
-1.36% |
|
| Con |
0.04% |
| Lab |
3.06% |
| LD |
-2.03% |
|
|
|
Charles Hendry
Conservative hold
|
| Con |
 |
26,279 |
49.81% |
| Lab |
 |
10,705 |
20.29% |
| LD |
 |
12,507 |
23.71% |
| Oth |
 |
3,265 |
6.19% |
| Maj |
 |
13,772 |
26.11% |
| Turn |
|
52,756 |
63.51% |
|
|
|
Charles Hendry
Conservative hold
|
| L |
Kathy Fordham |
10,705 |
20.29% |
| C |
Charles Hendry |
26,279 |
49.81% |
| LD |
Steve Murphy |
12,507 |
23.71% |
| UK |
Keith Riddle |
1,539 |
2.92% |
| G |
Julian Salmon |
1,273 |
2.41% |
| Pen |
Cyril Thornton |
453 |
0.86% |
|
Candidates representing 6 parties stood for election to this seat.
|
|
|
Geoffrey Johnson-Smith
Conservative
|
| Con |
|
29,417 |
49.78% |
| Lab |
|
10,185 |
17.23% |
| LD |
|
15,213 |
25.74% |
| Ref |
 |
3,527 |
5.97% |
| Oth |
|
757 |
1.28% |
| Maj |
|
14,204 |
24.03% |
| Turn |
|
59,099 |
74.32% |
|
|
|
|
Conservative
|
| Con |
|
37,256 |
61.70% |
| Lab |
|
5,578 |
9.20% |
| LD |
|
16,328 |
27.10% |
| Oth |
|
1,184 |
2.00% |
| Maj |
|
20,928 |
34.70% |
| Turn |
|
60,346 |
81.28% |
|
|
|
|
|