|
Wellingborough
Labour hold

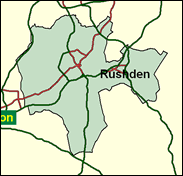
The third of Labour's super-narrow gains in Northamptonshire in 1997 (majority 187) forms another very vulnerable seat (conversely, this means they can afford to lose it and retain a very large overall majority, although that argument will not impress the sitting MP Paul Stinchcombe much). Peter Bone, who failed to hold Pudsey in West Yorkshire for his party last time, will try again to enter the Commons. He surely will do so, unless Labour does as well or even better than in 1997, which is not entirely impossible. Like the other close Northants seats, Wellingborough is a mixture of town and country. Labour held on well in the towns in the 1999 local elections, and differential turnout could be decisive in a knife-edge outcome; in general rural areas resist sags in turnout better than urban.

Paul Stinchcombe was elected in 1997. Although a barrister reared in the Lord Chancellor's chambers, he is not averse to criticising cuts in the legal aid budget and civil rights infringements in terrorism prevention legislation. He is a thoughtful critic in other areas, such as excessive green field site housing and harsher asylum laws. Born 1962, he was educated at High Wycombe Royal Grammar School, Trinity College Cambridge and Harvard Law School. Peter Bone, statistically the second most likely winner if any seats are to be lost by Labour, was supposed to be elected in 1997 in the previously safe Tory seat of Pudsey but was washed away in the Labour flood. A travel agent made famous by his Tory Party conference exposure in 1995 as an 87 pence an hour, low wage-paying employer, he was born 1952, educated at Westcliff-on-Sea Grammar School and was a Southend councillor for nine years.
 |
| Wealthy Achievers, Suburban Areas |
9.91% |
14.99% |
66.10 |
|
| Affluent Greys, Rural Communities |
0.14% |
2.13% |
6.52 |
|
| Prosperous Pensioners, Retirement Areas |
0.33% |
2.49% |
13.40 |
|
| Affluent Executives, Family Areas |
9.16% |
4.43% |
206.92 |
|
| Well-Off Workers, Family Areas |
13.69% |
7.27% |
188.21 |
|
| Affluent Urbanites, Town & City Areas |
0.22% |
2.56% |
8.43 |
|
| Prosperous Professionals, Metropolitan Areas |
0.00% |
2.04% |
0.00 |
|
| Better-Off Executives, Inner City Areas |
0.05% |
3.94% |
1.20 |
|
| Comfortable Middle Agers, Mature Home Owning Areas |
11.73% |
13.04% |
89.95 |
|
| Skilled Workers, Home Owning Areas |
21.37% |
12.70% |
168.20 |
|
| New Home Owners, Mature Communities |
11.27% |
8.14% |
138.38 |
|
| White Collar Workers, Better-Off Multi Ethnic Areas |
0.64% |
4.02% |
15.81 |
|
| Older People, Less Prosperous Areas |
5.13% |
3.19% |
161.19 |
|
| Council Estate Residents, Better-Off Homes |
11.60% |
11.31% |
102.53 |
|
| Council Estate Residents, High Unemployment |
0.40% |
3.06% |
13.22 |
|
| Council Estate Residents, Greatest Hardship |
4.31% |
2.52% |
170.94 |
|
| People in Multi-Ethnic, Low-Income Areas |
0.00% |
2.10% |
0.00 |
|
| Unclassified |
0.07% |
0.06% |
107.19 |
|
|
 |
 |
 |
| £0-5K |
8.90% |
9.41% |
94.60 |
|
| £5-10K |
17.07% |
16.63% |
102.60 |
|
| £10-15K |
17.64% |
16.58% |
106.41 |
|
| £15-20K |
14.53% |
13.58% |
107.00 |
|
| £20-25K |
10.97% |
10.39% |
105.55 |
|
| £25-30K |
8.01% |
7.77% |
102.98 |
|
| £30-35K |
5.78% |
5.79% |
99.87 |
|
| £35-40K |
4.18% |
4.33% |
96.59 |
|
| £40-45K |
3.05% |
3.27% |
93.32 |
|
| £45-50K |
2.24% |
2.48% |
90.19 |
|
| £50-55K |
1.66% |
1.90% |
87.24 |
|
| £55-60K |
1.25% |
1.47% |
84.49 |
|
| £60-65K |
0.94% |
1.15% |
81.94 |
|
| £65-70K |
0.72% |
0.91% |
79.60 |
|
| £70-75K |
0.56% |
0.72% |
77.43 |
|
| £75-80K |
0.43% |
0.57% |
75.43 |
|
| £80-85K |
0.34% |
0.46% |
73.58 |
|
| £85-90K |
0.27% |
0.37% |
71.87 |
|
| £90-95K |
0.21% |
0.31% |
70.29 |
|
| £95-100K |
0.17% |
0.25% |
68.82 |
|
| £100K + |
0.83% |
1.34% |
61.64 |
|
|
|

|


|
1992-1997
|
1997-2001
|
|
|
|
| Con |
-9.58% |
| Lab |
10.25% |
| LD |
-3.32% |
|
| Con |
-1.65% |
| Lab |
2.64% |
| LD |
-0.04% |
|
|
 |
Paul Stinchcombe
Labour hold
|
| Con |
 |
21,512 |
42.18% |
| Lab |
 |
23,867 |
46.79% |
| LD |
 |
4,763 |
9.34% |
| Oth |
 |
864 |
1.69% |
| Maj |
 |
2,355 |
4.62% |
| Turn |
 |
51,006 |
65.91% |
|
|
 |
Paul Stinchcombe
Labour hold
|
| C |
Peter Bone |
21,512 |
42.18% |
| UK |
Anthony Ellwood |
864 |
1.69% |
| LD |
Peter Gaskell |
4,763 |
9.34% |
| L |
Paul Stinchcombe |
23,867 |
46.79% |
|
Candidates representing 4 parties stood for election to this seat.
|
|
 |
Paul Stinchcombe
Labour gain
|
| Con |
 |
24,667 |
43.82% |
| Lab |
 |
24,854 |
44.15% |
| LD |
 |
5,279 |
9.38% |
| Ref |
|
0 |
0.00% |
| Oth |
 |
1,489 |
2.65% |
| Maj |
 |
187 |
0.33% |
| Turn |
 |
56,289 |
75.10% |
|
|
 |
|
Conservative
|
| Con |
 |
32,302 |
53.40% |
| Lab |
 |
20,486 |
33.90% |
| LD |
 |
7,714 |
12.70% |
| Oth |
|
0 |
0.00% |
| Maj |
 |
11,816 |
19.50% |
| Turn |
 |
60,502 |
81.44% |
|
|
 |
|

|

