|
Birmingham, Yardley
Labour hold

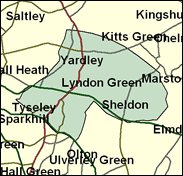
One of the most unusual recent electoral histories is to be found on the south eastern edge of Birmingham in the Yardley division. It does not look anything special. The territory covered by the wards of Acock's Green, Sheldon and Yardley itself seem typically suburban, with a racial and housing tenure mix close to the national average and a slightly more working class makeup than the norm. From 1945 to 1979 it was one of the best examples of a two party Labour - Conservative marginal, changing hands six times between them, three times each way. Then in 1992 a Liberal Democrat businessman, some said a millionaire, named John Hemming appeared on the scene. Already a councillor, he turned Yardley into a three way marginal. The Lib Dems utterly dominate the representation of this area on the city council, and if Hemming has never won a place in the Commons, he managed to increase his vote even during Labour's landslide in 1997, and the Liberal Democrats are the obvious challengers now should New Labour government, and one of its rising members, Estelle Morris, slip up. The Liberal Democrats even managed to poll the most votes here in the 1999 Euro-elections.

Labour's Estelle Morris, an intense, cadaverous, Mancunian-accented junior Education minister, and daughter and niece of two former Manchester MPs, has held this seat since 1992. A dogged performer from Labour's chalk face, she was born in 1952, educated at Whalley Range High School, Manchester, Coventry College of Education and Warwick University. and was a teacher for 18 years. She faces a three-cornered fight with the 57-year-old Conservative teacher, Barrie Roberts, and the persistent Liberal Democrat, John Hemmings, businessman and leader of the LibDem Birmingham councillors, who has fought the seat twice before. His strong second place in 1997 makes Yardley a potential embarrassment for his party's national campaigners who will be fighting on the tacit assumption of a Lib-Lab anti-Tory pact.

 |
| Wealthy Achievers, Suburban Areas |
0.00% |
14.99% |
0.00 |
|
| Affluent Greys, Rural Communities |
0.00% |
2.13% |
0.00 |
|
| Prosperous Pensioners, Retirement Areas |
0.00% |
2.49% |
0.00 |
|
| Affluent Executives, Family Areas |
0.08% |
4.43% |
1.72 |
|
| Well-Off Workers, Family Areas |
4.88% |
7.27% |
67.10 |
|
| Affluent Urbanites, Town & City Areas |
0.00% |
2.56% |
0.00 |
|
| Prosperous Professionals, Metropolitan Areas |
0.00% |
2.04% |
0.00 |
|
| Better-Off Executives, Inner City Areas |
3.32% |
3.94% |
84.16 |
|
| Comfortable Middle Agers, Mature Home Owning Areas |
13.26% |
13.04% |
101.67 |
|
| Skilled Workers, Home Owning Areas |
24.17% |
12.70% |
190.26 |
|
| New Home Owners, Mature Communities |
14.18% |
8.14% |
174.17 |
|
| White Collar Workers, Better-Off Multi Ethnic Areas |
3.87% |
4.02% |
96.21 |
|
| Older People, Less Prosperous Areas |
6.96% |
3.19% |
218.64 |
|
| Council Estate Residents, Better-Off Homes |
27.69% |
11.31% |
244.80 |
|
| Council Estate Residents, High Unemployment |
1.18% |
3.06% |
38.52 |
|
| Council Estate Residents, Greatest Hardship |
0.41% |
2.52% |
16.47 |
|
| People in Multi-Ethnic, Low-Income Areas |
0.00% |
2.10% |
0.00 |
|
| Unclassified |
0.00% |
0.06% |
0.00 |
|
|
 |
 |
 |
| £0-5K |
11.54% |
9.41% |
122.54 |
|
| £5-10K |
18.81% |
16.63% |
113.11 |
|
| £10-15K |
18.09% |
16.58% |
109.11 |
|
| £15-20K |
14.30% |
13.58% |
105.29 |
|
| £20-25K |
10.49% |
10.39% |
100.97 |
|
| £25-30K |
7.48% |
7.77% |
96.24 |
|
| £30-35K |
5.29% |
5.79% |
91.33 |
|
| £35-40K |
3.74% |
4.33% |
86.44 |
|
| £40-45K |
2.67% |
3.27% |
81.69 |
|
| £45-50K |
1.92% |
2.48% |
77.17 |
|
| £50-55K |
1.39% |
1.90% |
72.93 |
|
| £55-60K |
1.02% |
1.47% |
68.98 |
|
| £60-65K |
0.75% |
1.15% |
65.32 |
|
| £65-70K |
0.56% |
0.91% |
61.94 |
|
| £70-75K |
0.42% |
0.72% |
58.82 |
|
| £75-80K |
0.32% |
0.57% |
55.96 |
|
| £80-85K |
0.25% |
0.46% |
53.33 |
|
| £85-90K |
0.19% |
0.37% |
50.90 |
|
| £90-95K |
0.15% |
0.31% |
48.67 |
|
| £95-100K |
0.12% |
0.25% |
46.61 |
|
| £100K + |
0.50% |
1.34% |
37.11 |
|
|
|

|


|
1992-1997
|
1997-2001
|
|
|
|
| Con |
-16.67% |
| Lab |
12.15% |
| LD |
2.78% |
|
| Con |
-4.70% |
| Lab |
-0.12% |
| LD |
5.36% |
|
|
 |
Estelle Morris
Labour hold
|
| Con |
 |
3,941 |
13.13% |
| Lab |
 |
14,085 |
46.93% |
| LD |
 |
11,507 |
38.34% |
| Oth |
 |
480 |
1.60% |
| Maj |
 |
2,578 |
8.59% |
| Turn |
 |
30,013 |
57.23% |
|
|
 |
Estelle Morris
Labour hold
|
| LD |
John Hemming |
11,507 |
38.34% |
| L |
Estelle Morris |
14,085 |
46.93% |
| C |
Barrie Roberts |
3,941 |
13.13% |
| UK |
Alan Ware |
329 |
1.10% |
| SL |
Colin Wren |
151 |
0.50% |
|
Candidates representing 5 parties stood for election to this seat.
|
|
 |
Estelle Morris
Labour
|
| Con |
 |
6,736 |
17.83% |
| Lab |
 |
17,778 |
47.05% |
| LD |
 |
12,463 |
32.98% |
| Ref |
 |
646 |
1.71% |
| Oth |
 |
164 |
0.43% |
| Maj |
 |
5,315 |
14.07% |
| Turn |
 |
37,787 |
71.22% |
|
|
 |
|
Labour
|
| Con |
 |
14,722 |
34.50% |
| Lab |
 |
14,884 |
34.90% |
| LD |
 |
12,899 |
30.20% |
| Oth |
 |
192 |
0.40% |
| Maj |
 |
162 |
0.40% |
| Turn |
 |
42,697 |
76.76% |
|
|
 |
|

|

