|
Welwyn Hatfield
Labour hold

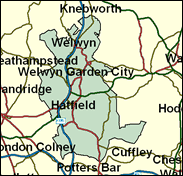
Recent local election evidence from the Welwyn Hatfield district suggests that the Conservatives have an outside chance of a regain in this Hertfordshire New Town constituency, but only in an unexpectedly good year for them (e.g. when they can draw level with Labour in the national vote share) and/or when Labour suffers from very low turnout in their heartland ex-local authority housing wards. There was one of the most bitter constituency battles in the land here in 1997, as the right wing and abrasive self-made Conservative businessman desperately struggled to hold on against New Labour in the form of Melanie Johnson, who has chosen not to marry her partner and father of her three children. Ms Johnson won by over 5,000 after an average swing. Her principal areas of support lay in the New Town neighbourhoods of Hatfield (south, central and west) and Welwyn Garden City (east of the railway tracks). Evans fought back in east Hatfield in the lee of the Victorian Titan Lord Salisbury's estate, in the western part of Welwyn Garden City, and in affluent commuting areas like Brookman's Park and villages like Essendon. This remains a crucial seat, one of those which will determine the outcome of the next general election and the identity of the next Government.

Melanie Johnson was elected in 1997 after selection from an all-women shortlist. A heroine, following the description of her by her Tory MP opponent David Evans as "a single girl, lives with her boyfriend, three bastard children, never done a proper job", she is currently Economic Secretary to the Treasury. As a loyalist back bencher she was heckled by some of her more left-wing sisters for defending university tuition fees. She was born 1955, attended Clifton High School for Girls, UCL and (inconclusively) King's College Cambridge, and worked for the Co-op before spending four years as a Schools Inspector. To Quentin Letts (late of The Telegraph) she is "as prim-lipped as a supermarket manageress".
 |
| Wealthy Achievers, Suburban Areas |
21.76% |
14.99% |
145.13 |
|
| Affluent Greys, Rural Communities |
0.01% |
2.13% |
0.26 |
|
| Prosperous Pensioners, Retirement Areas |
1.45% |
2.49% |
58.17 |
|
| Affluent Executives, Family Areas |
4.76% |
4.43% |
107.67 |
|
| Well-Off Workers, Family Areas |
4.36% |
7.27% |
59.93 |
|
| Affluent Urbanites, Town & City Areas |
3.95% |
2.56% |
154.01 |
|
| Prosperous Professionals, Metropolitan Areas |
1.05% |
2.04% |
51.25 |
|
| Better-Off Executives, Inner City Areas |
1.57% |
3.94% |
39.81 |
|
| Comfortable Middle Agers, Mature Home Owning Areas |
10.27% |
13.04% |
78.76 |
|
| Skilled Workers, Home Owning Areas |
10.23% |
12.70% |
80.54 |
|
| New Home Owners, Mature Communities |
14.56% |
8.14% |
178.79 |
|
| White Collar Workers, Better-Off Multi Ethnic Areas |
0.47% |
4.02% |
11.77 |
|
| Older People, Less Prosperous Areas |
6.54% |
3.19% |
205.29 |
|
| Council Estate Residents, Better-Off Homes |
17.43% |
11.31% |
154.06 |
|
| Council Estate Residents, High Unemployment |
1.19% |
3.06% |
38.78 |
|
| Council Estate Residents, Greatest Hardship |
0.25% |
2.52% |
9.97 |
|
| People in Multi-Ethnic, Low-Income Areas |
0.16% |
2.10% |
7.48 |
|
| Unclassified |
0.01% |
0.06% |
10.64 |
|
|
 |
 |
 |
| £0-5K |
6.95% |
9.41% |
73.78 |
|
| £5-10K |
13.08% |
16.63% |
78.66 |
|
| £10-15K |
14.40% |
16.58% |
86.85 |
|
| £15-20K |
12.90% |
13.58% |
94.96 |
|
| £20-25K |
10.65% |
10.39% |
102.46 |
|
| £25-30K |
8.50% |
7.77% |
109.30 |
|
| £30-35K |
6.69% |
5.79% |
115.50 |
|
| £35-40K |
5.25% |
4.33% |
121.16 |
|
| £40-45K |
4.12% |
3.27% |
126.32 |
|
| £45-50K |
3.25% |
2.48% |
131.04 |
|
| £50-55K |
2.58% |
1.90% |
135.38 |
|
| £55-60K |
2.05% |
1.47% |
139.38 |
|
| £60-65K |
1.65% |
1.15% |
143.07 |
|
| £65-70K |
1.33% |
0.91% |
146.48 |
|
| £70-75K |
1.08% |
0.72% |
149.65 |
|
| £75-80K |
0.88% |
0.57% |
152.59 |
|
| £80-85K |
0.72% |
0.46% |
155.33 |
|
| £85-90K |
0.59% |
0.37% |
157.88 |
|
| £90-95K |
0.49% |
0.31% |
160.27 |
|
| £95-100K |
0.41% |
0.25% |
162.50 |
|
| £100K + |
2.33% |
1.34% |
173.21 |
|
|
|

|


|
1992-1997
|
1997-2001
|
|
|
|
| Con |
-10.99% |
| Lab |
11.08% |
| LD |
-2.48% |
|
| Con |
3.86% |
| Lab |
-3.91% |
| LD |
0.54% |
|
|
 |
Melanie Johnson
Labour hold
|
| Con |
 |
17,288 |
40.37% |
| Lab |
 |
18,484 |
43.17% |
| LD |
 |
6,021 |
14.06% |
| Oth |
 |
1,028 |
2.40% |
| Maj |
 |
1,196 |
2.79% |
| Turn |
 |
42,821 |
63.91% |
|
|
 |
Melanie Johnson
Labour hold
|
| UK |
Malcolm Biggs |
798 |
1.86% |
| LD |
Daniel Cooke |
6,021 |
14.06% |
| L |
Melanie Johnson |
18,484 |
43.17% |
| P |
Fiona Pinto |
230 |
0.54% |
| C |
Grant Shapps |
17,288 |
40.37% |
|
Candidates representing 5 parties stood for election to this seat.
|
|
 |
Melanie Johnson
Labour gain
|
| Con |
 |
19,341 |
36.51% |
| Lab |
 |
24,936 |
47.08% |
| LD |
 |
7,161 |
13.52% |
| Ref |
|
0 |
0.00% |
| Oth |
 |
1,530 |
2.89% |
| Maj |
 |
5,595 |
10.56% |
| Turn |
 |
52,968 |
78.59% |
|
|
 |
|
Conservative
|
| Con |
 |
27,139 |
47.50% |
| Lab |
 |
20,556 |
36.00% |
| LD |
 |
9,147 |
16.00% |
| Oth |
 |
247 |
0.40% |
| Maj |
 |
6,583 |
11.50% |
| Turn |
 |
57,089 |
83.34% |
|
|
 |
|

|

