|
West Bromwich East
Labour hold

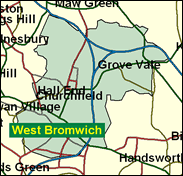
This seat was a genuine marginal for two decades, even if the Tories never won it, until this appearance was dissolved by the one great wrench of the 1997 General Election. Labour have underperformed in the Black Country if one looks at its very working-class makeup, and they have done even worse in several of the local government boroughs here, such as Sandwell in this case, where Liberal Democrats have figured prominently too. With a substantial Asian population in central West Bromwich, and large council estates in wards such as Friar Park, it is hard to explain by mere statistics why this seat has not been even better for Peter Snape, an amiable and diligent - and now retiring - MP. It takes an understanding of the particular history, culture and attitudes of the majority population in this part of the world.

Tom Watson has replaced Labour's retiring Peter Snape. Confirming Labour's still-important union links, he is a political officer in the AEEU, in which role he was active in the Rover Task Force set up to defend the threatened car industry. Born 1967, he was educated at King Charles I High School, Kidderminster, joined the Labour Party at 16 and formerly worked for it as a development officer. Active at Labour grass roots as Chairman of Wyre Forest CLP, he edits 'Liberal Demolition', a quarterly magazine opposing the Liberal Democrats, reportedly campaigns against PR as national co-ordinator of the First Past the Post Campaign, and aims to make Sandwell (the local borough) a "Liberal-free zone".
 |
| Wealthy Achievers, Suburban Areas |
4.63% |
14.99% |
30.88 |
|
| Affluent Greys, Rural Communities |
0.00% |
2.13% |
0.00 |
|
| Prosperous Pensioners, Retirement Areas |
0.07% |
2.49% |
3.00 |
|
| Affluent Executives, Family Areas |
0.81% |
4.43% |
18.21 |
|
| Well-Off Workers, Family Areas |
5.08% |
7.27% |
69.89 |
|
| Affluent Urbanites, Town & City Areas |
0.47% |
2.56% |
18.33 |
|
| Prosperous Professionals, Metropolitan Areas |
0.00% |
2.04% |
0.00 |
|
| Better-Off Executives, Inner City Areas |
0.09% |
3.94% |
2.33 |
|
| Comfortable Middle Agers, Mature Home Owning Areas |
10.10% |
13.04% |
77.46 |
|
| Skilled Workers, Home Owning Areas |
15.56% |
12.70% |
122.49 |
|
| New Home Owners, Mature Communities |
15.04% |
8.14% |
184.65 |
|
| White Collar Workers, Better-Off Multi Ethnic Areas |
1.84% |
4.02% |
45.66 |
|
| Older People, Less Prosperous Areas |
4.14% |
3.19% |
129.89 |
|
| Council Estate Residents, Better-Off Homes |
30.84% |
11.31% |
272.68 |
|
| Council Estate Residents, High Unemployment |
4.58% |
3.06% |
149.58 |
|
| Council Estate Residents, Greatest Hardship |
4.36% |
2.52% |
173.18 |
|
| People in Multi-Ethnic, Low-Income Areas |
2.38% |
2.10% |
113.14 |
|
| Unclassified |
0.01% |
0.06% |
19.94 |
|
|
 |
 |
 |
| £0-5K |
14.29% |
9.41% |
151.81 |
|
| £5-10K |
21.60% |
16.63% |
129.84 |
|
| £10-15K |
18.83% |
16.58% |
113.60 |
|
| £15-20K |
13.74% |
13.58% |
101.17 |
|
| £20-25K |
9.48% |
10.39% |
91.23 |
|
| £25-30K |
6.45% |
7.77% |
83.02 |
|
| £30-35K |
4.41% |
5.79% |
76.11 |
|
| £35-40K |
3.04% |
4.33% |
70.21 |
|
| £40-45K |
2.13% |
3.27% |
65.12 |
|
| £45-50K |
1.51% |
2.48% |
60.69 |
|
| £50-55K |
1.08% |
1.90% |
56.82 |
|
| £55-60K |
0.79% |
1.47% |
53.40 |
|
| £60-65K |
0.58% |
1.15% |
50.37 |
|
| £65-70K |
0.43% |
0.91% |
47.67 |
|
| £70-75K |
0.33% |
0.72% |
45.25 |
|
| £75-80K |
0.25% |
0.57% |
43.08 |
|
| £80-85K |
0.19% |
0.46% |
41.11 |
|
| £85-90K |
0.15% |
0.37% |
39.32 |
|
| £90-95K |
0.12% |
0.31% |
37.70 |
|
| £95-100K |
0.09% |
0.25% |
36.21 |
|
| £100K + |
0.39% |
1.34% |
29.37 |
|
|
|

|


|
1992-1997
|
1997-2001
|
|
|
|
| Con |
-13.49% |
| Lab |
9.25% |
| LD |
1.59% |
|
| Con |
1.58% |
| Lab |
-1.28% |
| LD |
-1.10% |
|
|
 |
Tom Watson
Labour hold
|
| Con |
 |
8,487 |
25.98% |
| Lab |
 |
18,250 |
55.87% |
| LD |
 |
4,507 |
13.80% |
| Oth |
 |
1,420 |
4.35% |
| Maj |
 |
9,763 |
29.89% |
| Turn |
 |
32,664 |
53.37% |
|
|
 |
Tom Watson
Labour hold
|
| LD |
Ian Garrett |
4,507 |
13.80% |
| UK |
Steven Grey |
835 |
2.56% |
| SL |
Sheera Johal |
585 |
1.79% |
| C |
David MacFarlane |
8,487 |
25.98% |
| L |
Tom Watson |
18,250 |
55.87% |
|
Candidates representing 5 parties stood for election to this seat.
|
|
 |
Peter Snape
Labour
|
| Con |
 |
10,126 |
24.41% |
| Lab |
 |
23,710 |
57.15% |
| LD |
 |
6,179 |
14.89% |
| Ref |
 |
1,472 |
3.55% |
| Oth |
|
0 |
0.00% |
| Maj |
 |
13,584 |
32.74% |
| Turn |
 |
41,487 |
65.44% |
|
|
 |
|
Labour
|
| Con |
 |
18,797 |
37.90% |
| Lab |
 |
23,782 |
47.90% |
| LD |
 |
6,591 |
13.30% |
| Oth |
 |
477 |
1.00% |
| Maj |
 |
4,985 |
10.00% |
| Turn |
 |
49,647 |
73.84% |
|
|
 |
|

|

