|
Western Isles
Labour hold

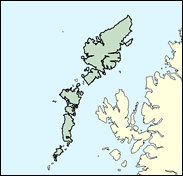
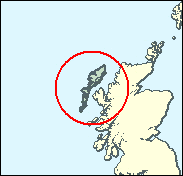
One of the most individual constituencies in the UK, Western Isles - or the Outer Hebrides of Lewis, Harris, Benbecula, Unst and smaller islands - has the smallest electorate, only 23,000. It also has the highest proportion of Gaelic speakers, the strongest Sabbatarian traditions, and curiously the highest proportion of detached houses, 68pc. These are not mansions or modern executive developments but crofts, often occupied by own account small farmers scratching a meagre living from what soil and pasture there is. There is the second highest percentage of those employed in agricultural and fishing pursuits (not forestry in a treeless landscape). There is also a very strong working class profile in terms of manual jobs. All this adds up to a unique culture and a unique politics, which has successively shown immense loyalty to Labour's Malcolm Macmillan (MP 1935-70) followed by the SNP's Donald Stewart, (1970-87, initially as his party's sole representative in the Commons). There is a good chance that Calum Macdonald will benefit from a similar pattern. Swings are low in a constituency of personal loyalties and strong convictions. The Conservatives and Liberal Democrats have no presence to speak of here. The SNP struggle to rise from second place. Westminster may seem remote, 600 miles and a sea crossing away; but then so does Edinburgh.

Calum Macdonald, elected in 1987 as a native son of Lewis, born 1956 and educated at Nicolson Institute, Stornaway and Edinburgh University, taught political philosophy at University of California, Los Angeles, for three years. With a characteristic strong Hebridean accent which, as with North Welsh-speakers, can make English sound very much like a second language, he became a minister in Donald Dewar's Scottish Office (1997-99) until devolution left it hollowed-out and him redundant. A keen Europhile, who rebelled to vote with the Tories for Maastricht, he also favours close links with the Liberal Democrats but reflects conservative Hebridean - whether Catholic or Protestant - views on abortion.
 |
| Wealthy Achievers, Suburban Areas |
9.52% |
14.99% |
63.48 |
|
| Affluent Greys, Rural Communities |
20.47% |
2.13% |
962.59 |
|
| Prosperous Pensioners, Retirement Areas |
2.06% |
2.49% |
83.02 |
|
| Affluent Executives, Family Areas |
4.80% |
4.43% |
108.42 |
|
| Well-Off Workers, Family Areas |
0.07% |
7.27% |
0.96 |
|
| Affluent Urbanites, Town & City Areas |
0.00% |
2.56% |
0.00 |
|
| Prosperous Professionals, Metropolitan Areas |
0.00% |
2.04% |
0.00 |
|
| Better-Off Executives, Inner City Areas |
0.27% |
3.94% |
6.90 |
|
| Comfortable Middle Agers, Mature Home Owning Areas |
25.90% |
13.04% |
198.64 |
|
| Skilled Workers, Home Owning Areas |
7.79% |
12.70% |
61.35 |
|
| New Home Owners, Mature Communities |
7.50% |
8.14% |
92.08 |
|
| White Collar Workers, Better-Off Multi Ethnic Areas |
1.83% |
4.02% |
45.47 |
|
| Older People, Less Prosperous Areas |
2.18% |
3.19% |
68.49 |
|
| Council Estate Residents, Better-Off Homes |
12.69% |
11.31% |
112.16 |
|
| Council Estate Residents, High Unemployment |
0.88% |
3.06% |
28.84 |
|
| Council Estate Residents, Greatest Hardship |
3.72% |
2.52% |
147.54 |
|
| People in Multi-Ethnic, Low-Income Areas |
0.06% |
2.10% |
2.63 |
|
| Unclassified |
0.27% |
0.06% |
430.82 |
|
|
 |
 |
 |
| £0-5K |
12.04% |
9.41% |
127.87 |
|
| £5-10K |
21.45% |
16.63% |
128.97 |
|
| £10-15K |
19.86% |
16.58% |
119.79 |
|
| £15-20K |
14.69% |
13.58% |
108.13 |
|
| £20-25K |
10.04% |
10.39% |
96.56 |
|
| £25-30K |
6.69% |
7.77% |
86.02 |
|
| £30-35K |
4.44% |
5.79% |
76.73 |
|
| £35-40K |
2.98% |
4.33% |
68.69 |
|
| £40-45K |
2.02% |
3.27% |
61.77 |
|
| £45-50K |
1.39% |
2.48% |
55.82 |
|
| £50-55K |
0.97% |
1.90% |
50.69 |
|
| £55-60K |
0.68% |
1.47% |
46.25 |
|
| £60-65K |
0.49% |
1.15% |
42.40 |
|
| £65-70K |
0.35% |
0.91% |
39.04 |
|
| £70-75K |
0.26% |
0.72% |
36.09 |
|
| £75-80K |
0.19% |
0.57% |
33.49 |
|
| £80-85K |
0.14% |
0.46% |
31.19 |
|
| £85-90K |
0.11% |
0.37% |
29.13 |
|
| £90-95K |
0.08% |
0.31% |
27.29 |
|
| £95-100K |
0.06% |
0.25% |
25.64 |
|
| £100K + |
0.25% |
1.34% |
18.59 |
|
|
|

|


|
1992-1997
|
1997-2001
|
|
|
|
| Con |
-1.85% |
| Lab |
7.80% |
| LD |
-0.33% |
| SNP |
-3.80% |
|
| Con |
2.85% |
| Lab |
-10.58% |
| LD |
3.38% |
| SNP |
3.46% |
|
|
 |
Calum MacDonald
Labour hold
|
| Con |
 |
1,250 |
9.50% |
| Lab |
 |
5,924 |
45.02% |
| LD |
 |
849 |
6.45% |
| SNP |
 |
4,850 |
36.86% |
| Oth |
 |
286 |
2.17% |
| Maj |
 |
1,074 |
8.16% |
| Turn |
 |
13,159 |
60.34% |
|
|
 |
Calum MacDonald
Labour hold
|
| LD |
John Horne |
849 |
6.45% |
| L |
Calum MacDonald |
5,924 |
45.02% |
| SNP |
Alasdair Nicholson |
4,850 |
36.86% |
| C |
Douglas Taylor |
1,250 |
9.50% |
| SSP |
Joanne Telfer |
286 |
2.17% |
|
Candidates representing 5 parties stood for election to this seat.
|
|
 |
Calum McDonald
Labour
|
| Con |
 |
1,071 |
6.65% |
| Lab |
 |
8,955 |
55.60% |
| LD |
 |
495 |
3.07% |
| SNP |
 |
5,379 |
33.40% |
| Ref |
 |
206 |
1.28% |
| Oth |
|
0 |
0.00% |
| Maj |
 |
3,576 |
22.20% |
| Turn |
 |
16,106 |
70.08% |
|
|
 |
|
Labour
|
| Con |
 |
1,362 |
8.50% |
| Lab |
 |
7,664 |
47.80% |
| LD |
 |
552 |
3.40% |
| SNP |
 |
5,961 |
37.20% |
| Oth |
 |
491 |
3.10% |
| Maj |
 |
1,703 |
10.60% |
| Turn |
 |
16,030 |
69.65% |
|
|
 |
|

|

